DevSecOps on Azure - part10: Detect and respond to security events in Azure with Microsoft Sentinel

Introduction
This is the last article from the series called DevSecOps practices for Azure cloud workloads. Keeping application solutions on Azure secure requires constant security monitoring and evaluation of threats from source code up to running workloads. In this article, I would like to present what Microsoft Sentinel is and how it can help with security incidents in the Azure environment and DevOps platforms.
Microsoft Sentinel and its capabilities
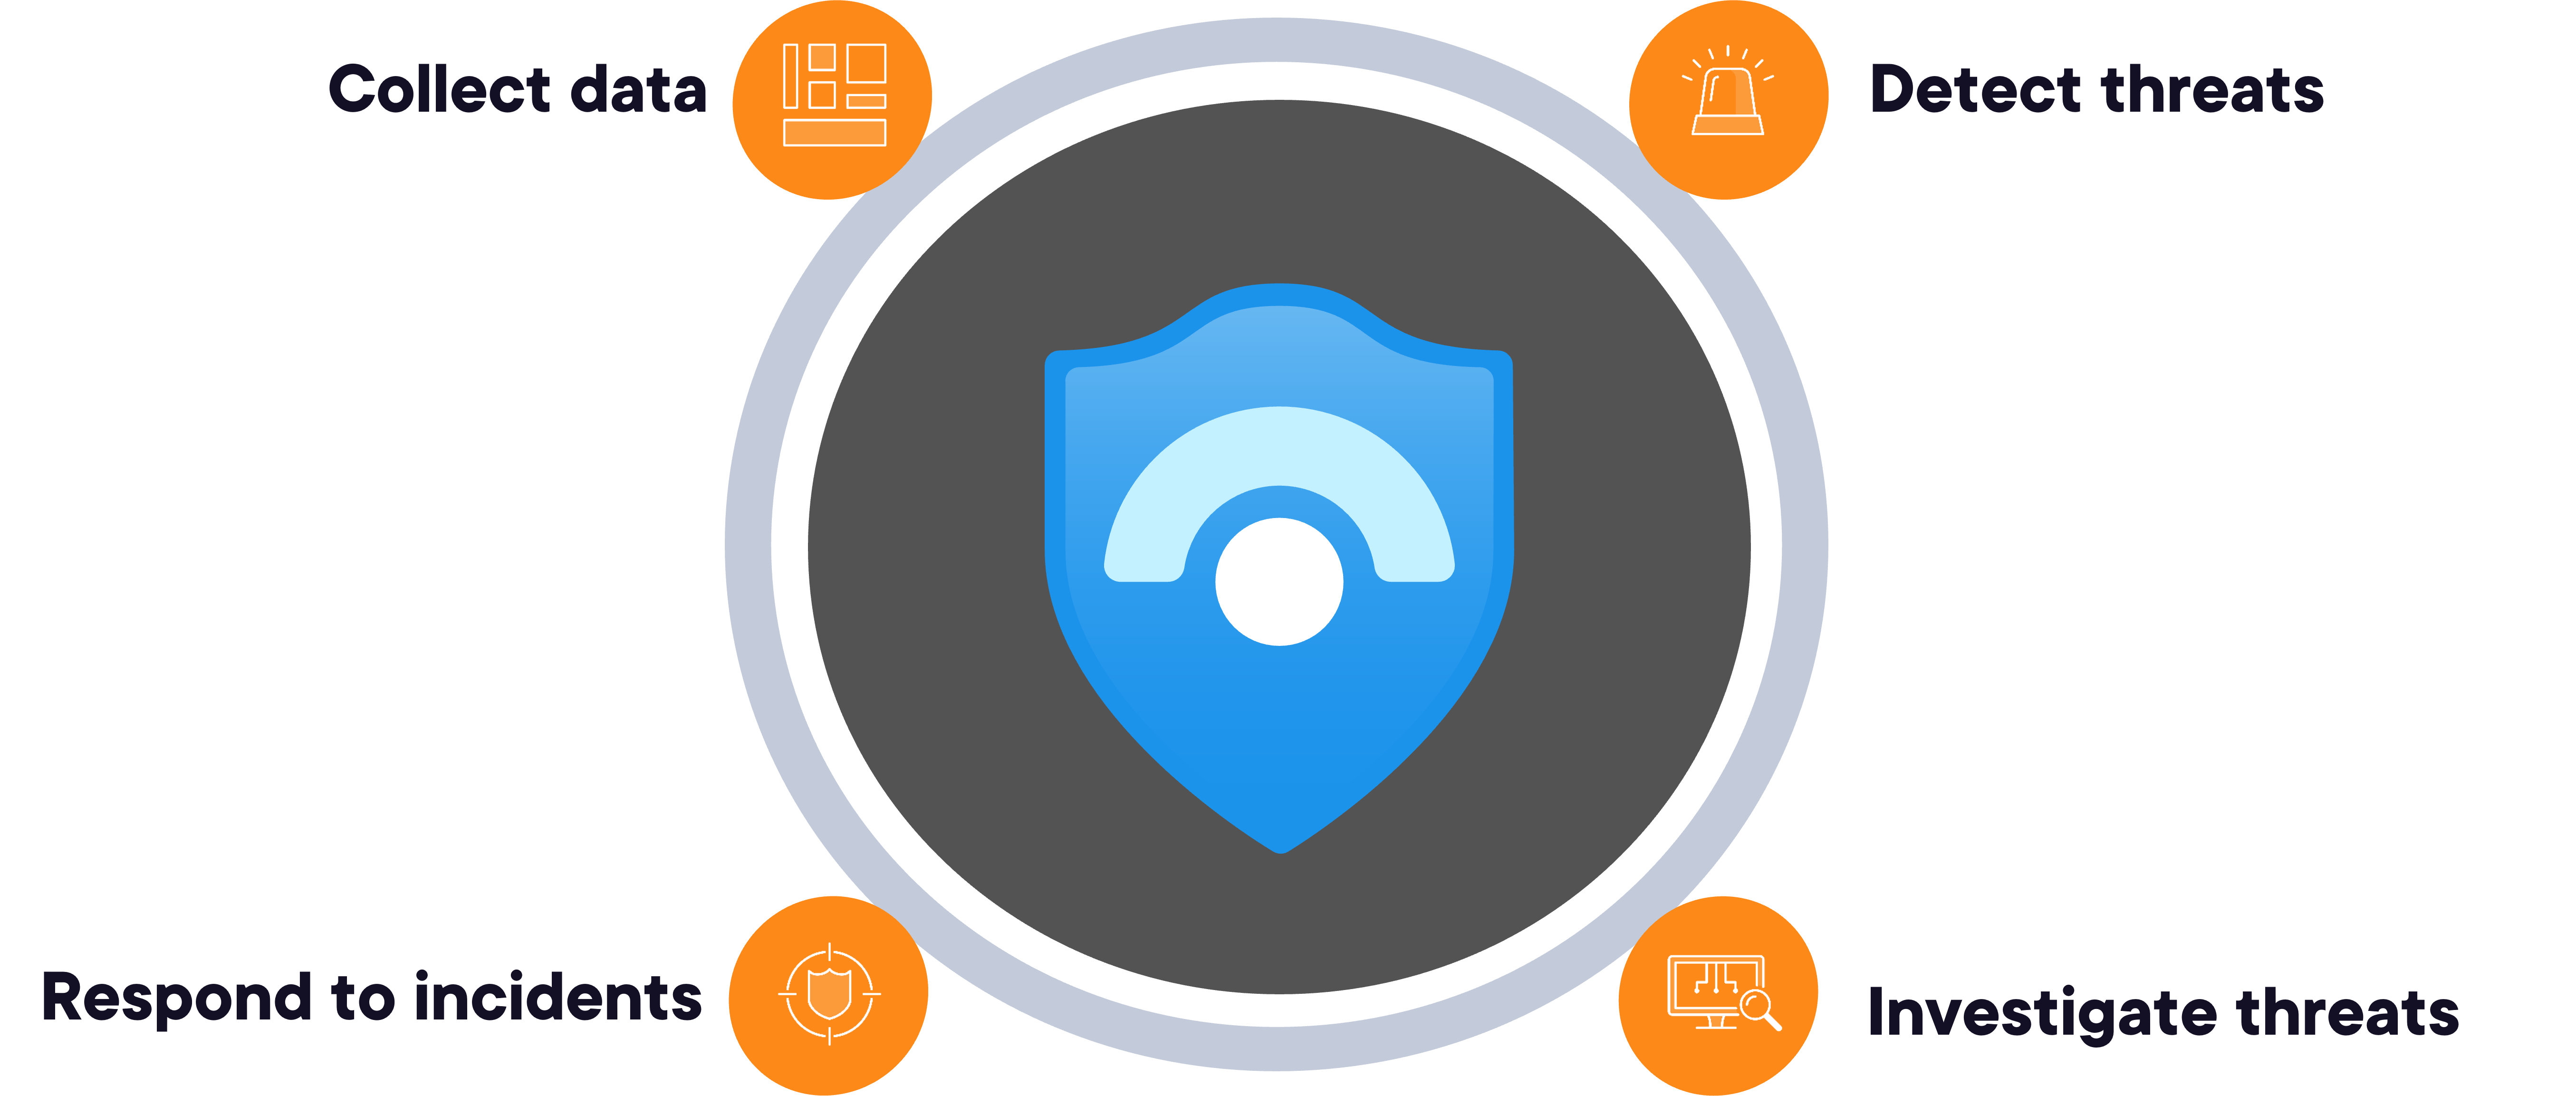
Microsoft Sentinel is a scalable, cloud-native, security information event management (SIEM) and security orchestration automated response (SOAR) solution. It provides intelligent security analytics and threat intelligence, providing a single solution for alert detection, threat visibility, proactive hunting, and threat response.
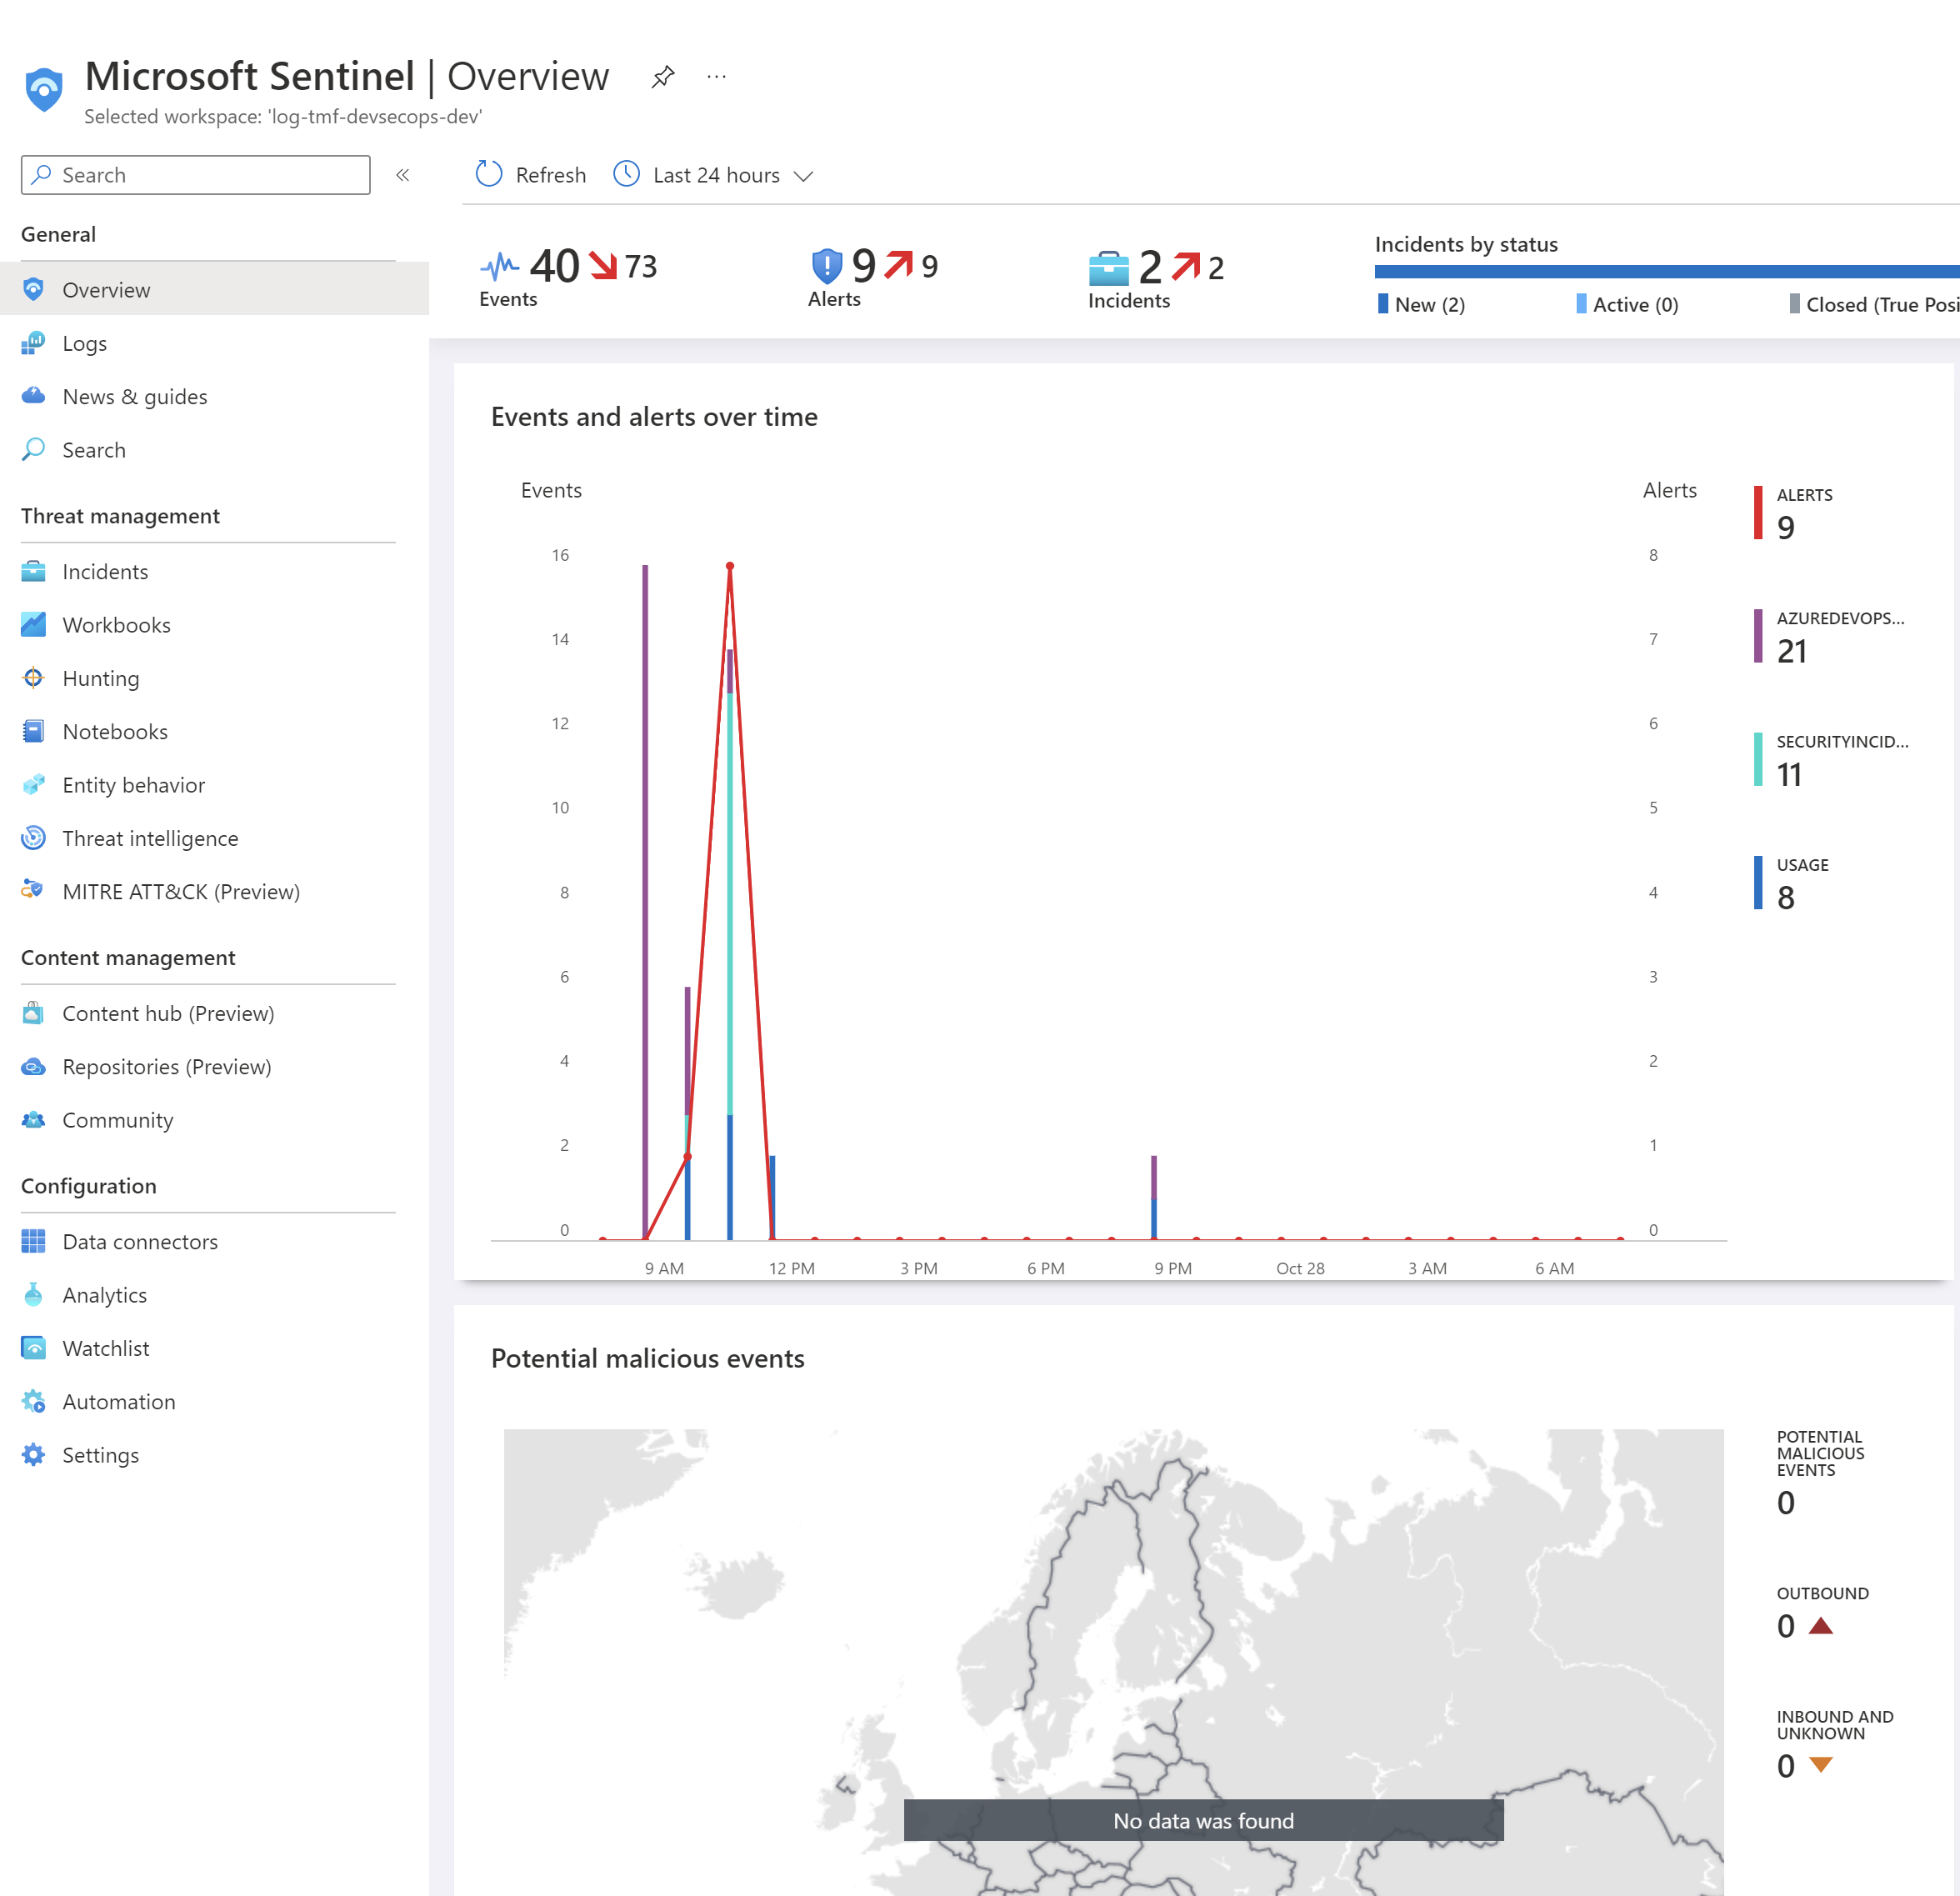
Microsoft Sentinel requires a Log Analytics workspace to collect and analyze data. It can be a new or existing workspace. Here is the main dashboard of Microsoft Sentinel:
Data Connectors
Once the Log Analytics workspace is connected, Data Connectors can be configured to start ingesting data into Microsoft Sentinel. There are many out-of-the-box connectors for Microsoft services, which can be integrated in real-time. There are many different connectors for Microsoft services but also for non-Microsoft products. We can also ingest data with REST APIs and Common Event Format (CEF) used as data format:
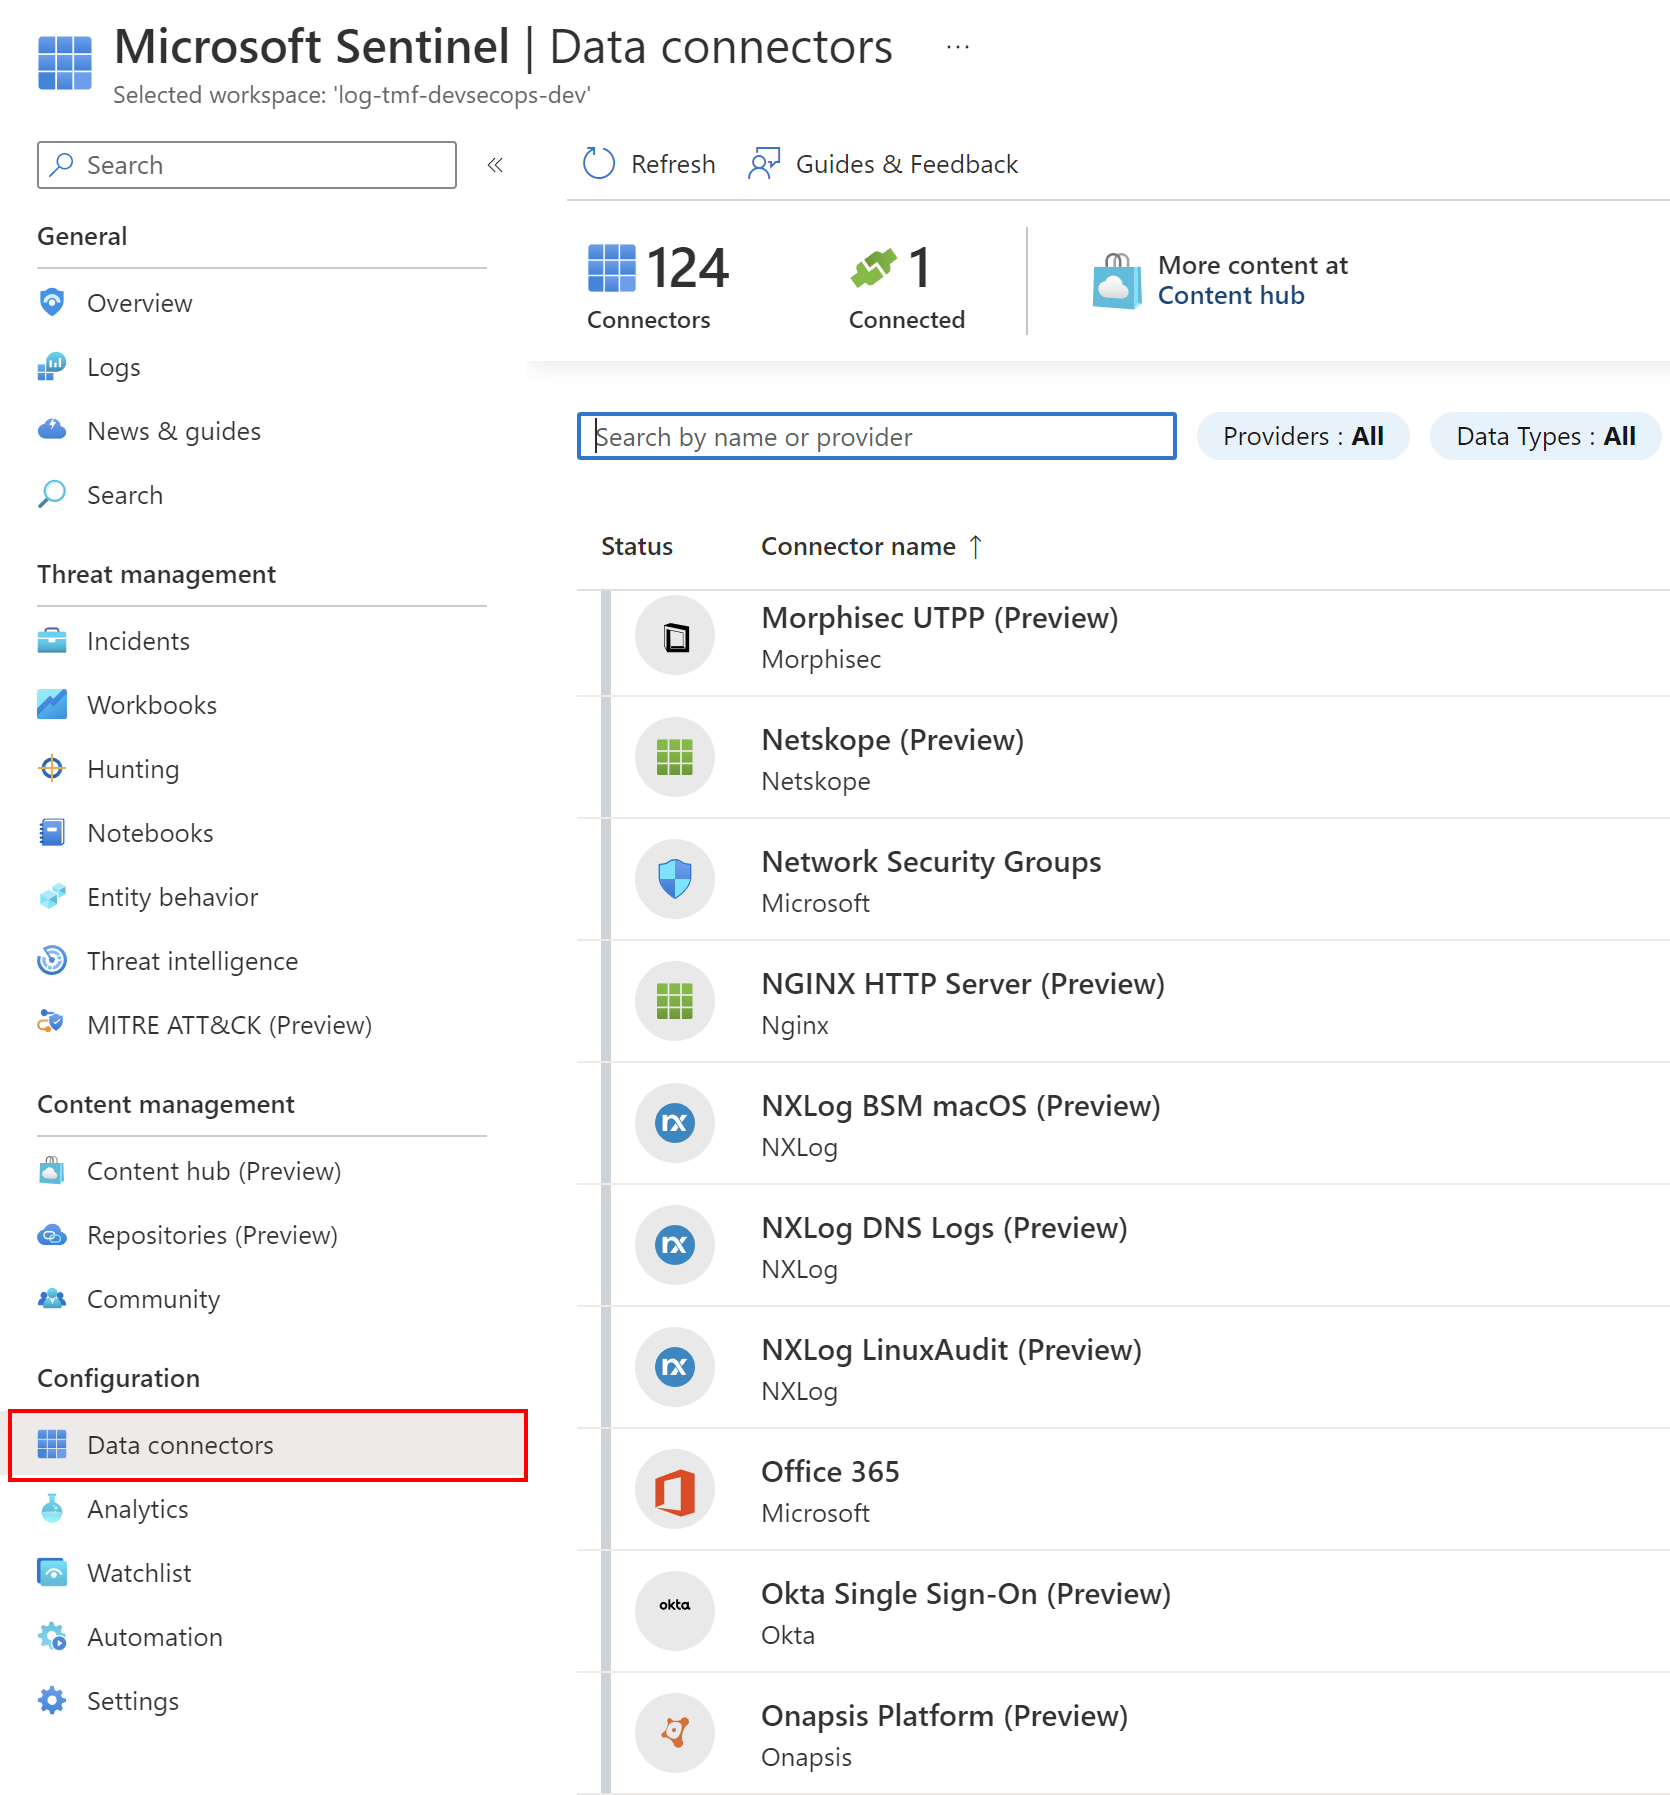
Data Connectors Examples:
- Azure Active Directory Data Connector
- Azure Key Vault Data Connector
- Microsoft Defender for Cloud Data Connector
- Salesforce Service Cloud
Analytics Rules
Microsoft Sentinel provides built-in templates to help create threat detection rules based on data ingested by specific Data Connectors. For instance, once we connect Microsoft Defender for Cloud connector, we can create incidents (I am explaining them below) automatically in the Microsoft Sentinel dashboard:
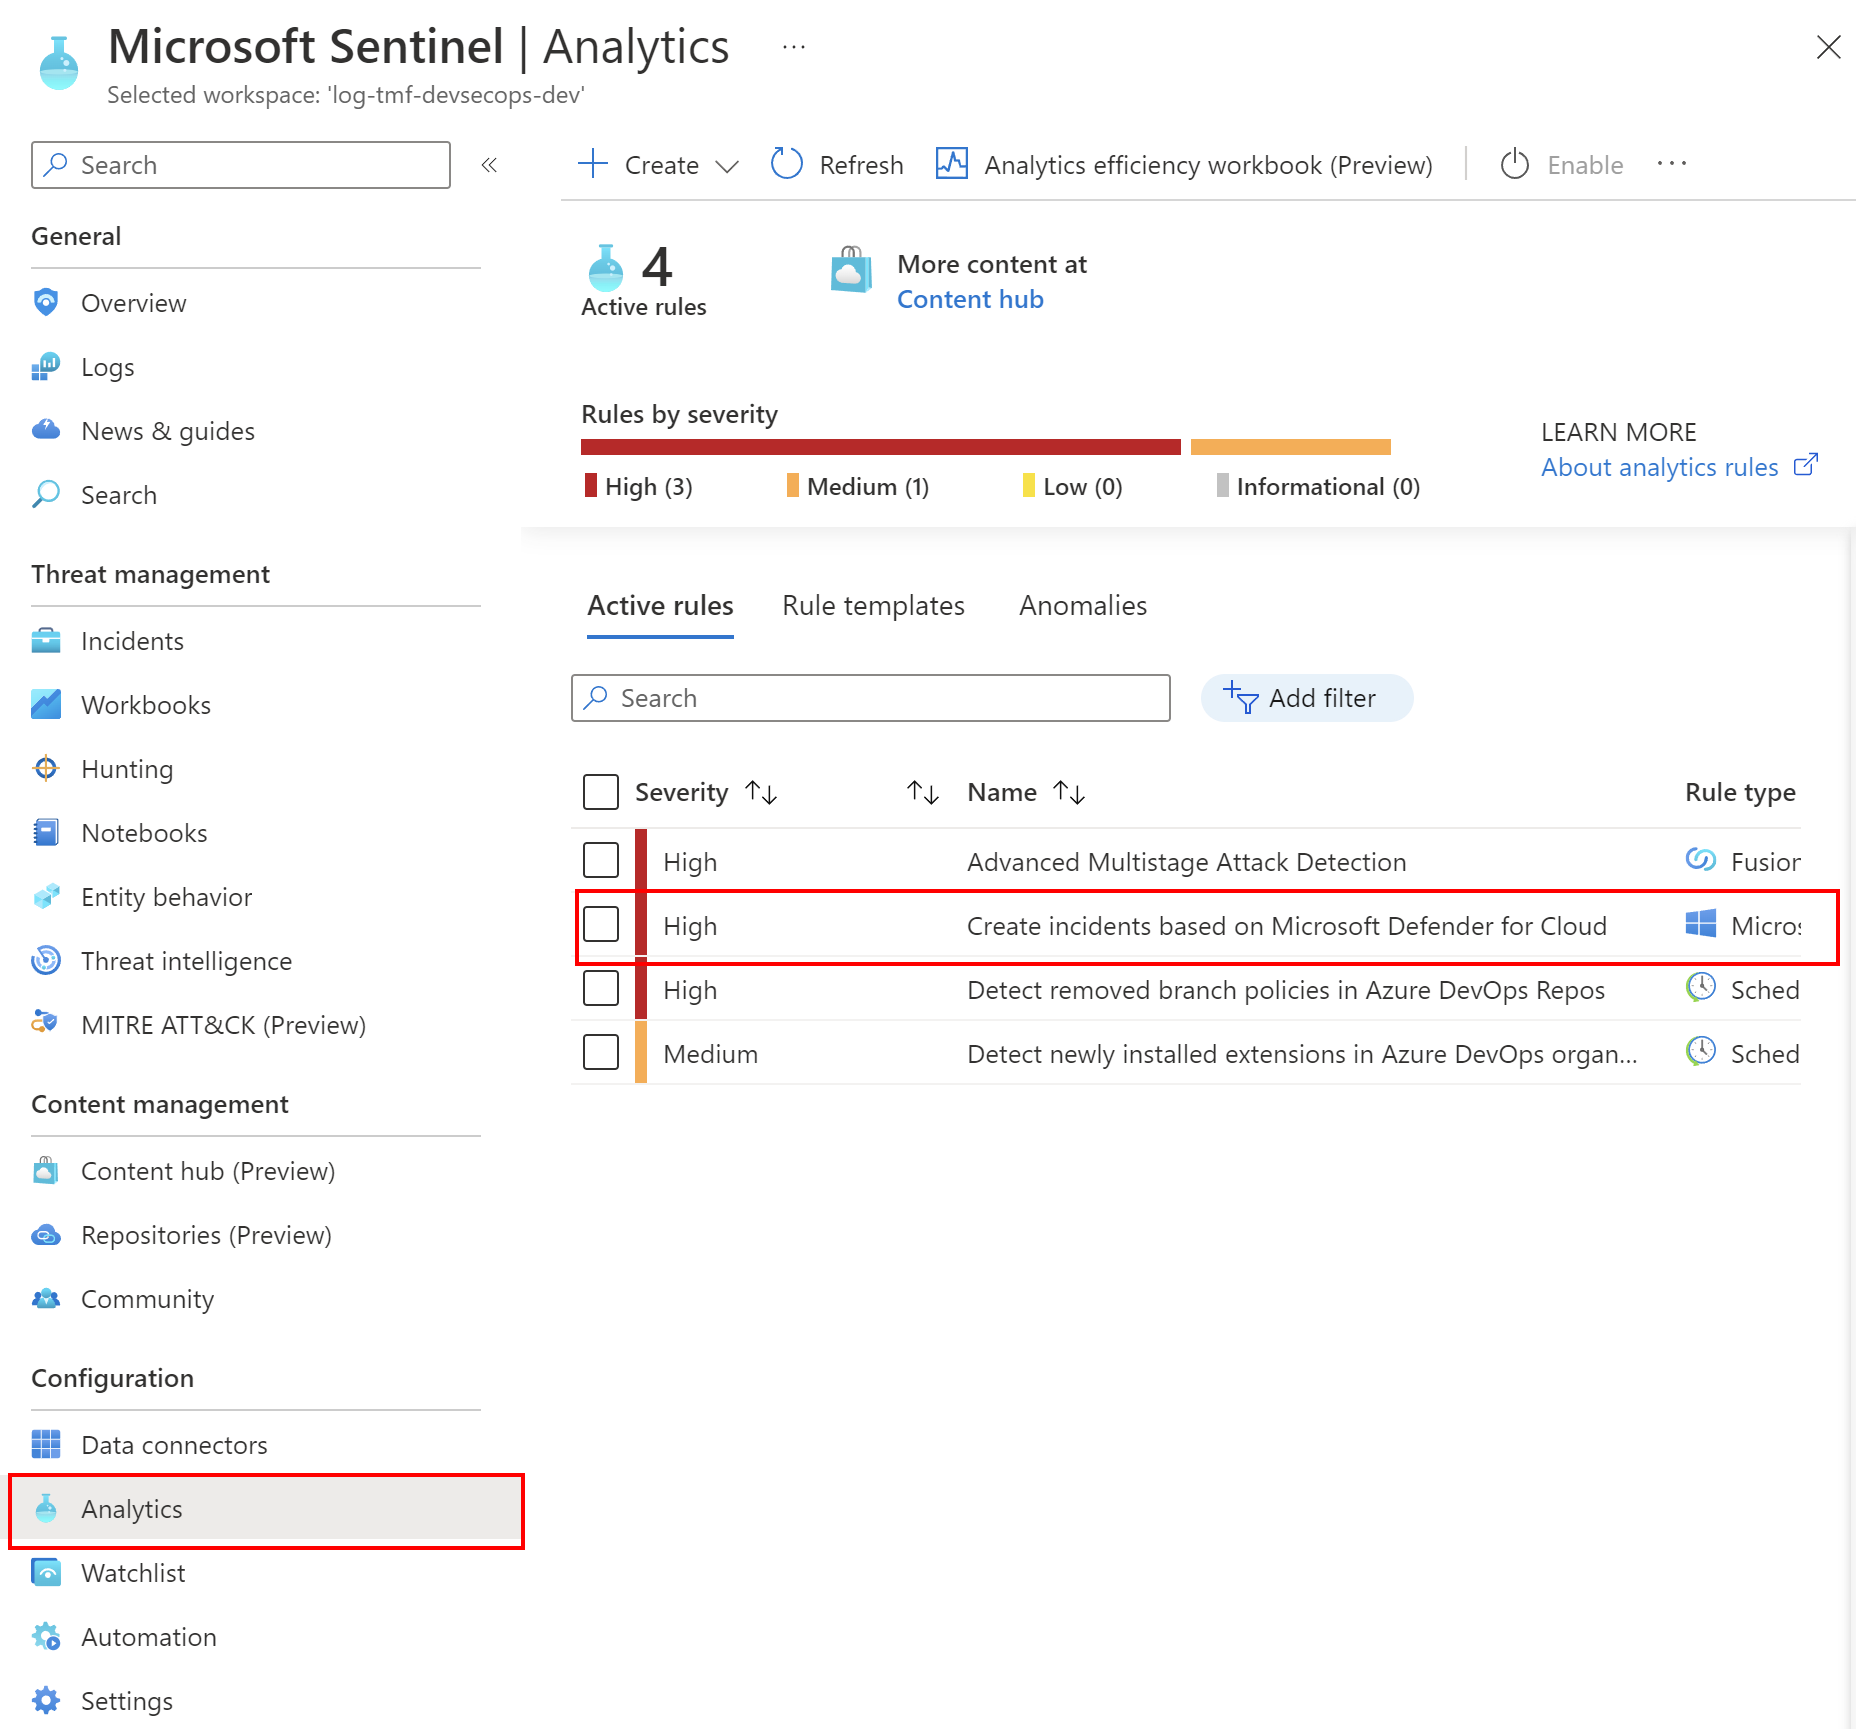
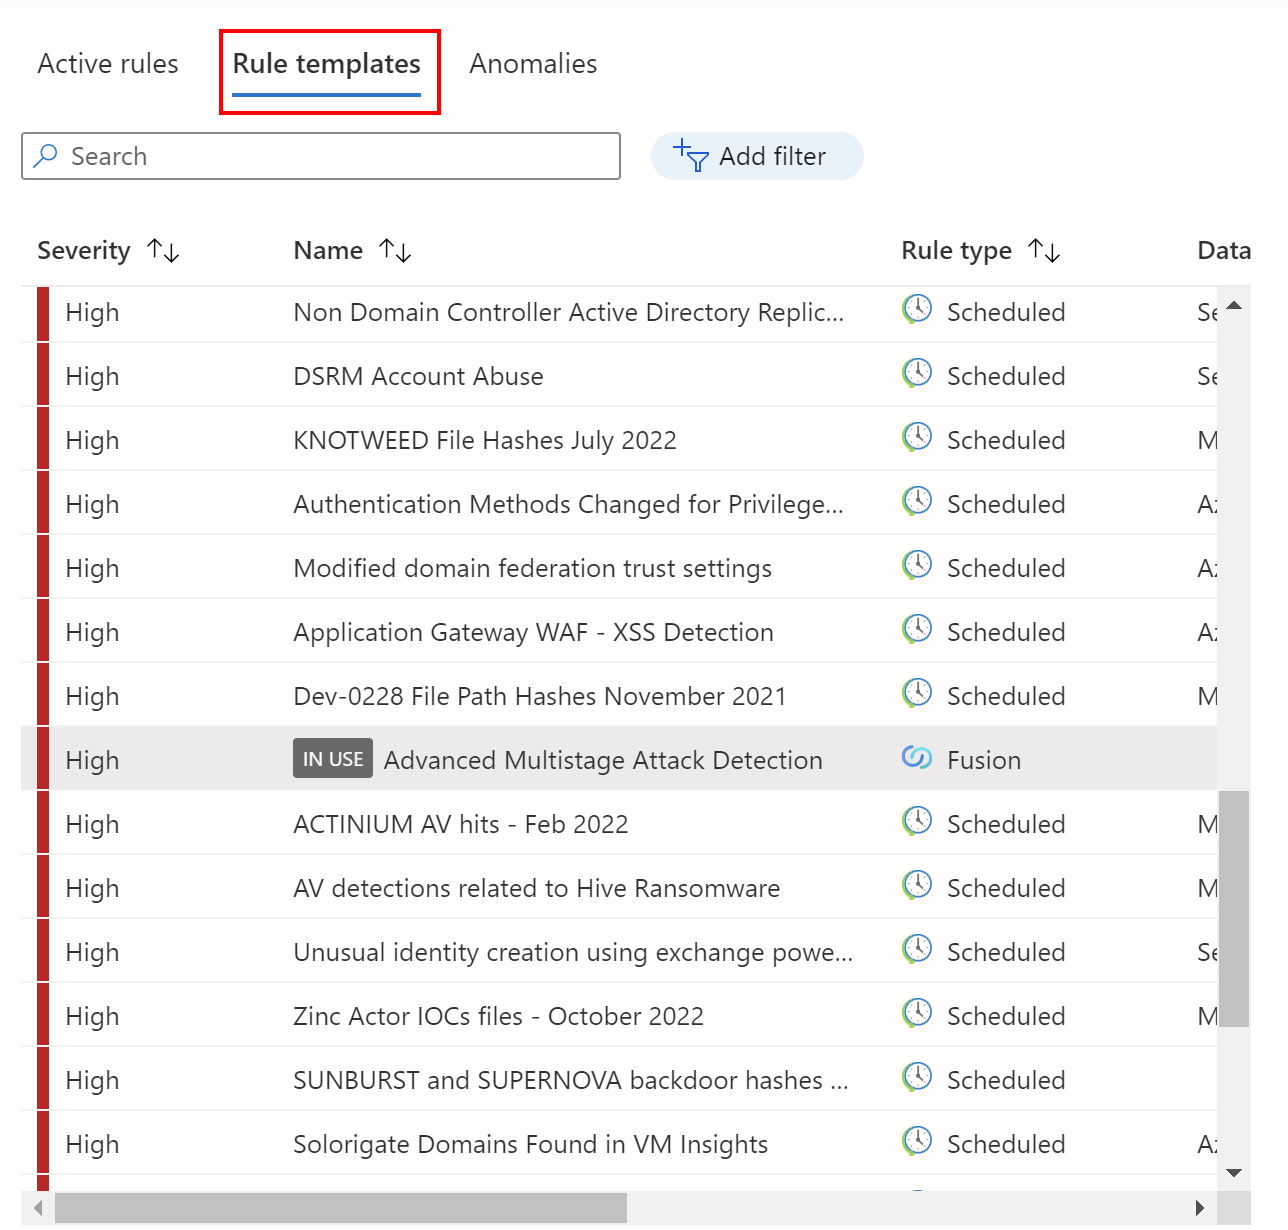
We can also create custom Analytics Rules in Microsoft Sentinel based on our specific needs.
Incidents
Incidents are groups of related alerts that together create an actionable possible threat that you can investigate and resolve. Microsoft Sentinel uses analytics to correlate alerts into incidents. It is important to remember that alerts triggered in Microsoft security solutions that are connected to Microsoft Sentinel, such as Microsoft Defender for Cloud don’t automatically create incidents in Microsoft Sentinel. We can decide which built-in rules should create Microsoft Sentinel incidents automatically in real-time. By default, when we connect a Microsoft solution to Microsoft Sentinel, any alert generated in that service will be stored as raw data in Microsoft Sentinel. Rules can be edited to define more specific options for filtering which of the alerts generated by the Microsoft security solution should create incidents in Microsoft Sentinel.
Automation Rules
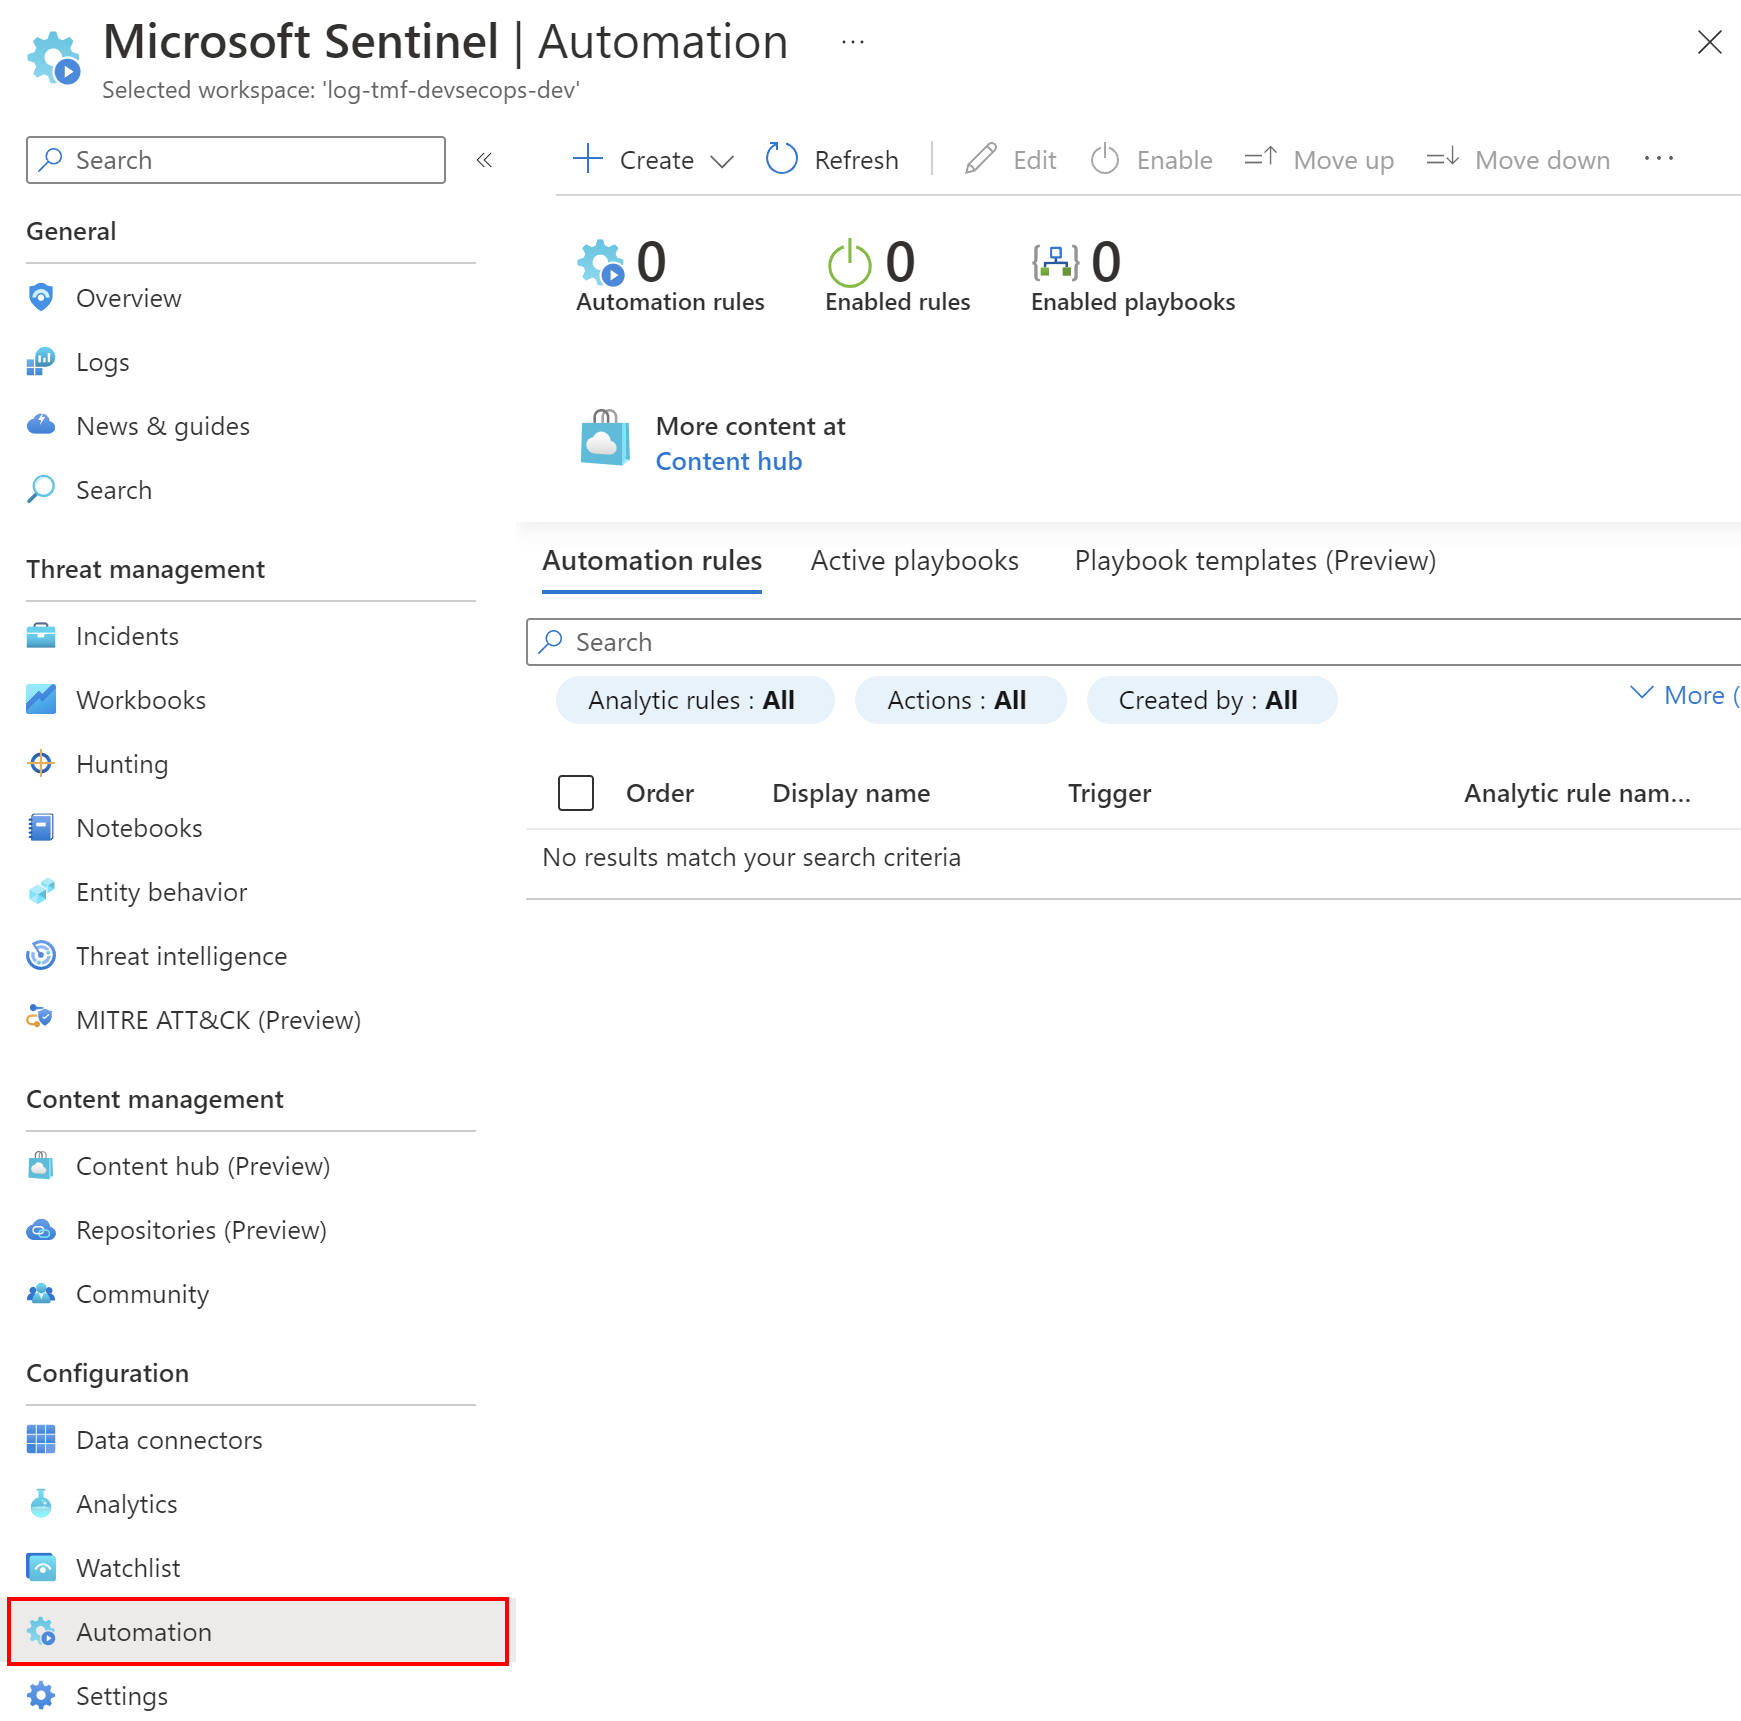
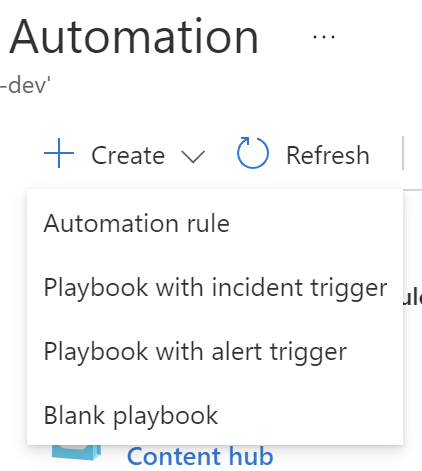
Automation rules help investigate incidents in Microsoft Sentinel. They can be used to automatically assign incidents to the right person, close noisy incidents or known false positives, change their severity, and add tags. They are also the mechanism by which playbooks (I am explaining them below) can be run in response to incidents.
Playbook
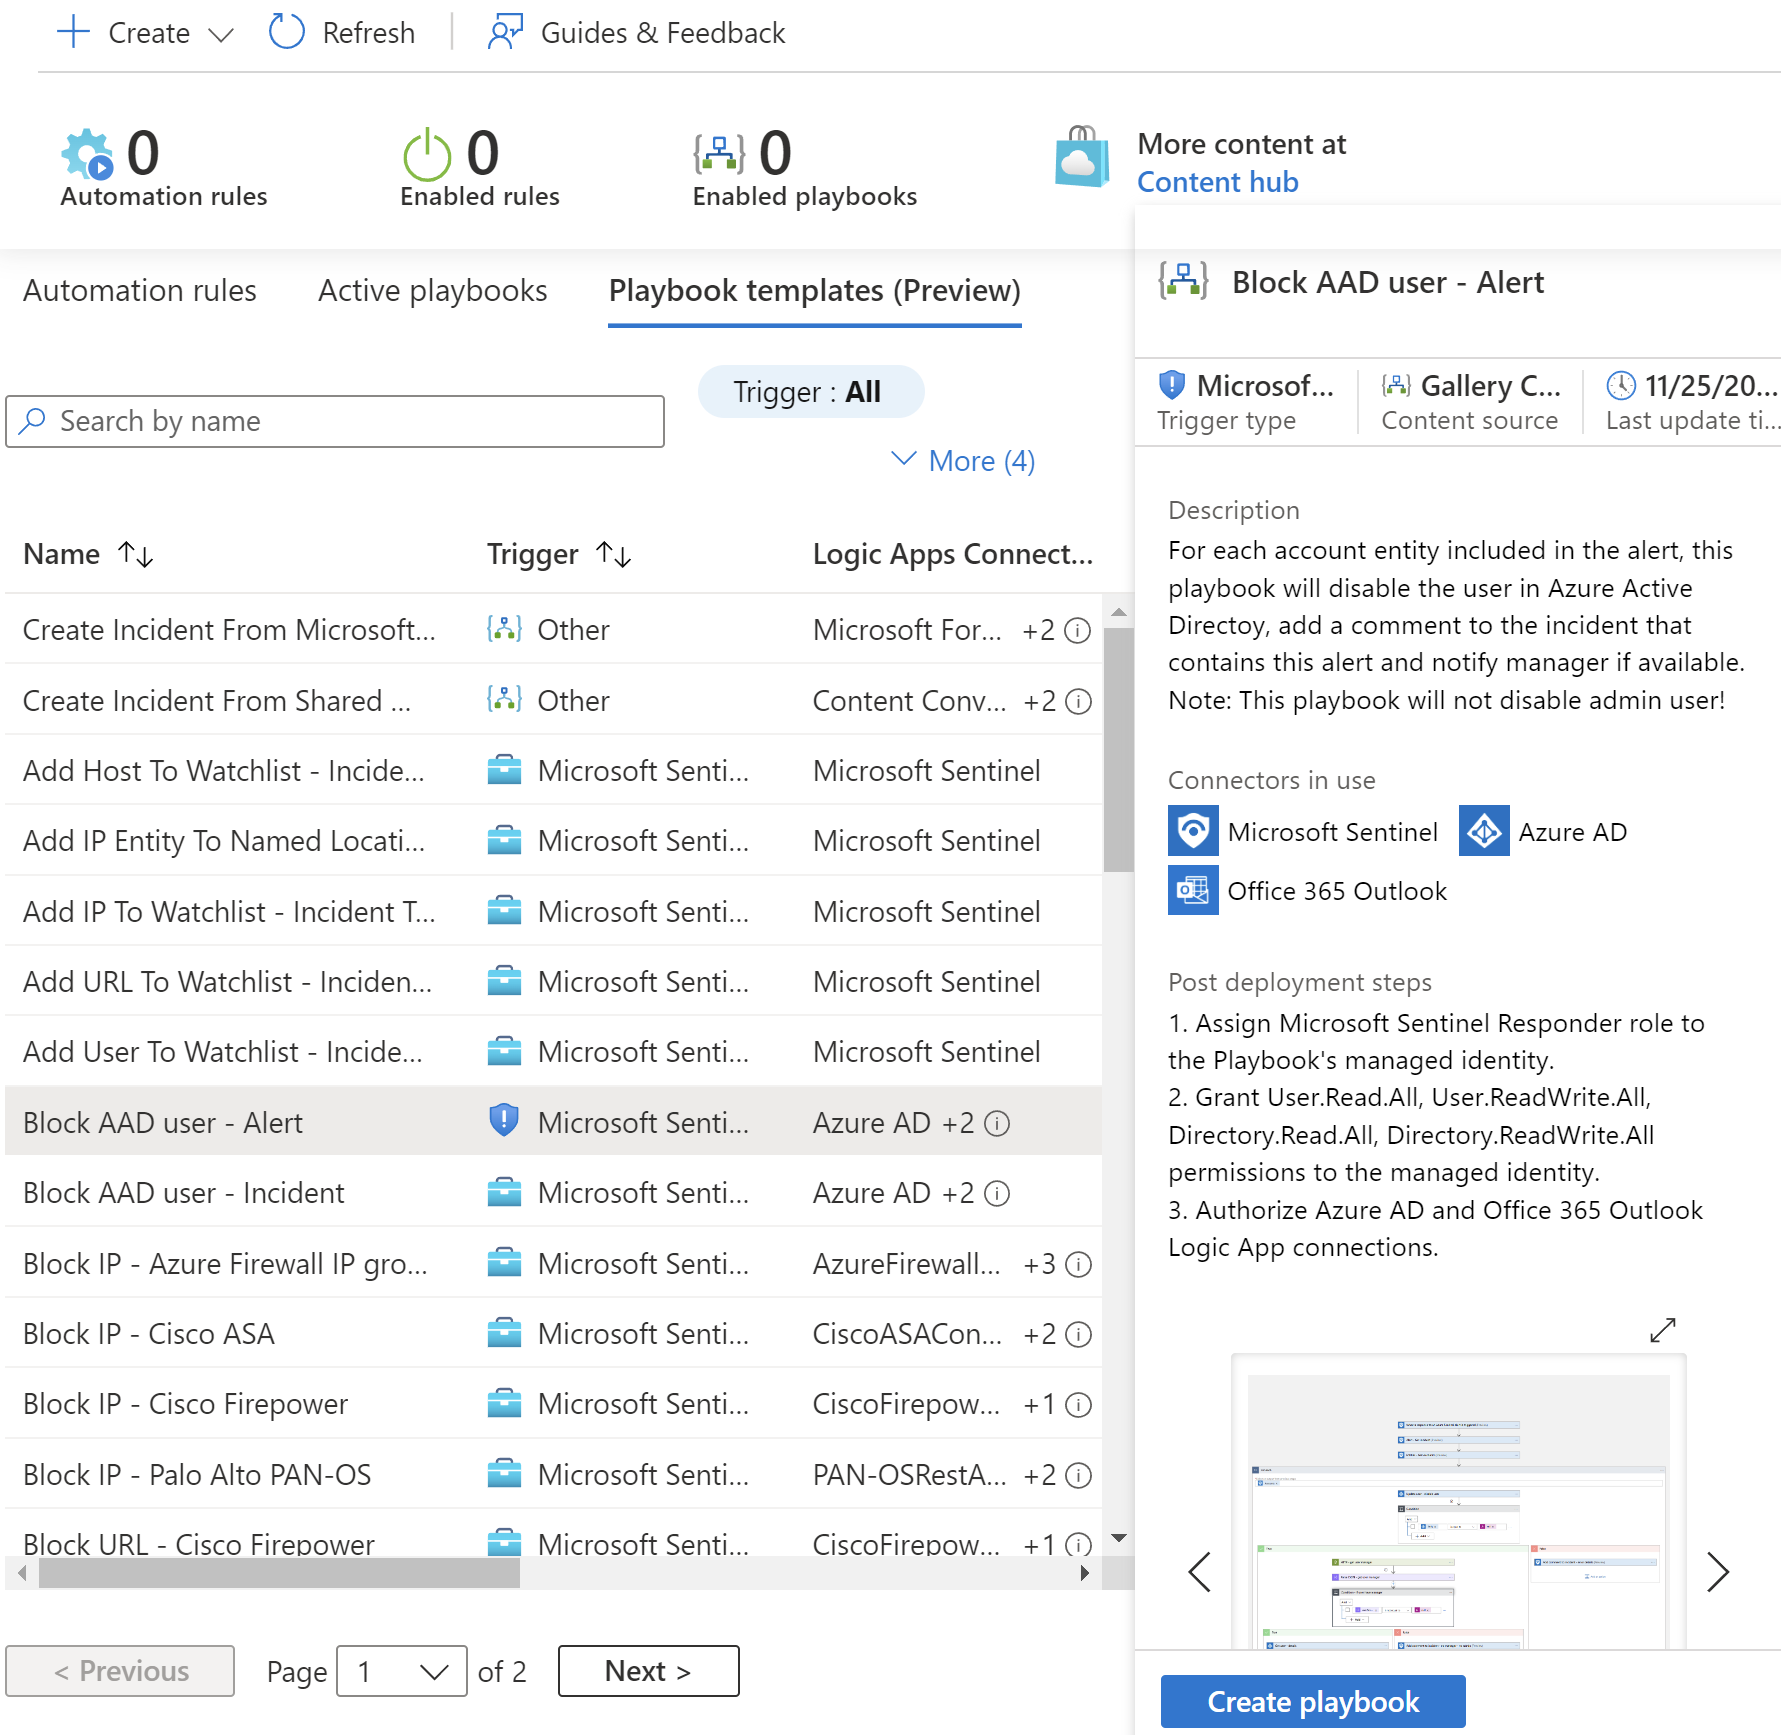
Playbooks are collections of procedures that can be run from Microsoft Sentinel in response to an alert or incident. A playbook can help automate and orchestrate response and can be set to run automatically when specific alerts or incidents are generated. It is worth mentioning that PlayBooks are just Logic Apps triggered from Sentinel when an incident or alert is created.
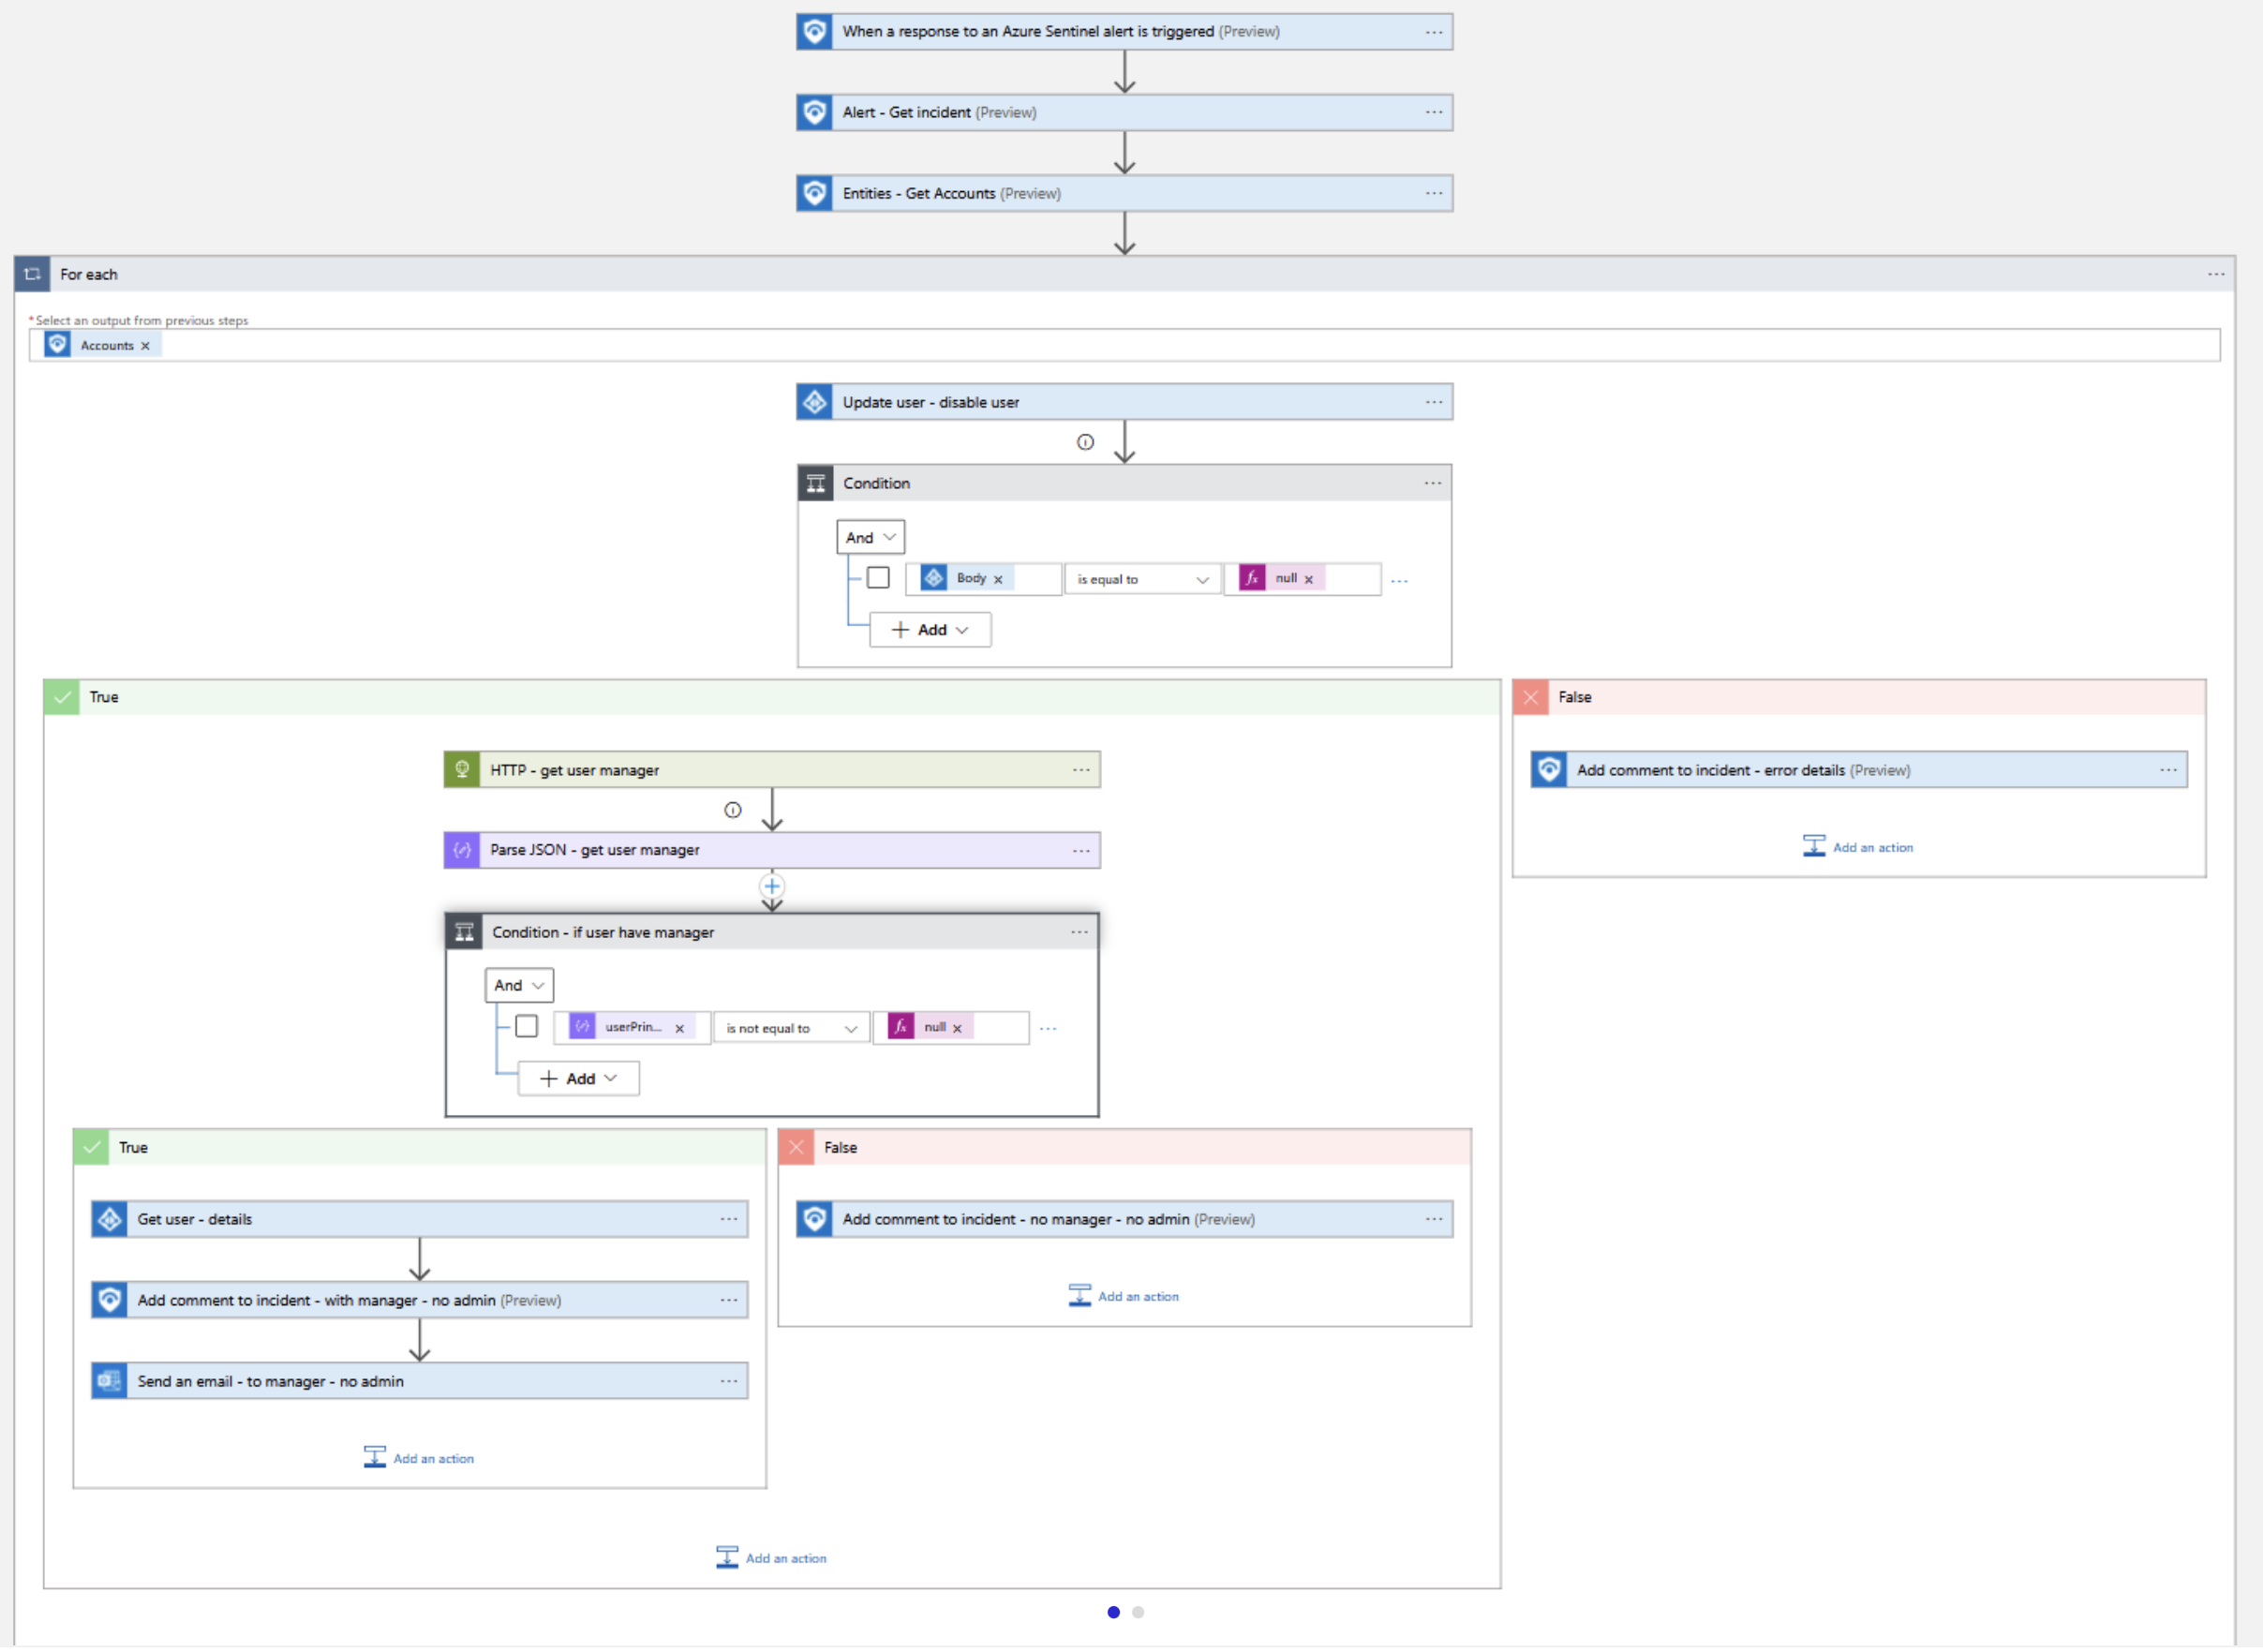
We can create our PlayBooks or utilize templates:
Microsoft Sentinel with DevOps platforms
Microsoft Sentinel can be used to keep an eye on the security posture of DevOps platforms like Azure DevOps or GitHub. In this article, I would like to show how to monitor Azure DevOps however before this, let me write a few things about GitHub also.
GitHub monitoring with Microsoft Sentinel
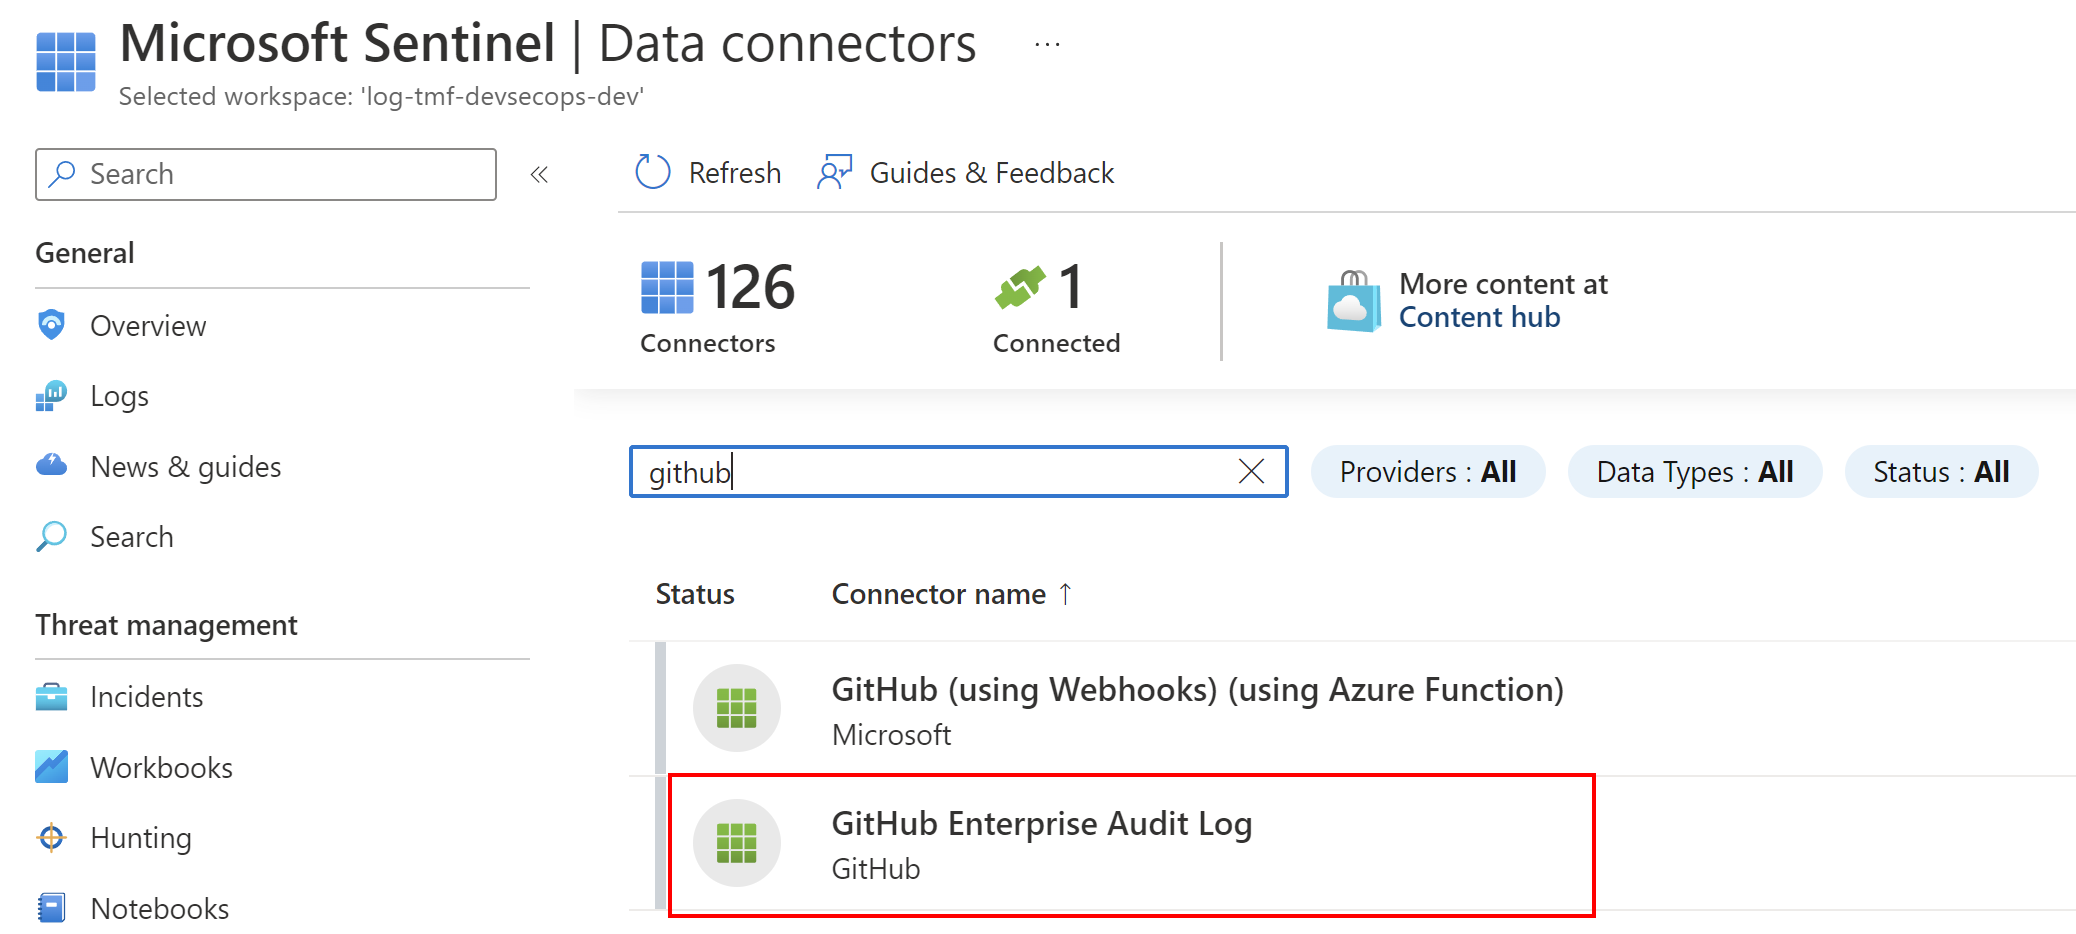
Microsoft Sentinel has a dedicated connector for monitoring GitHub. It enables to easily ingest of events and logs from GitHub to Microsoft Sentinel using GitHub audit log API and Webhooks.
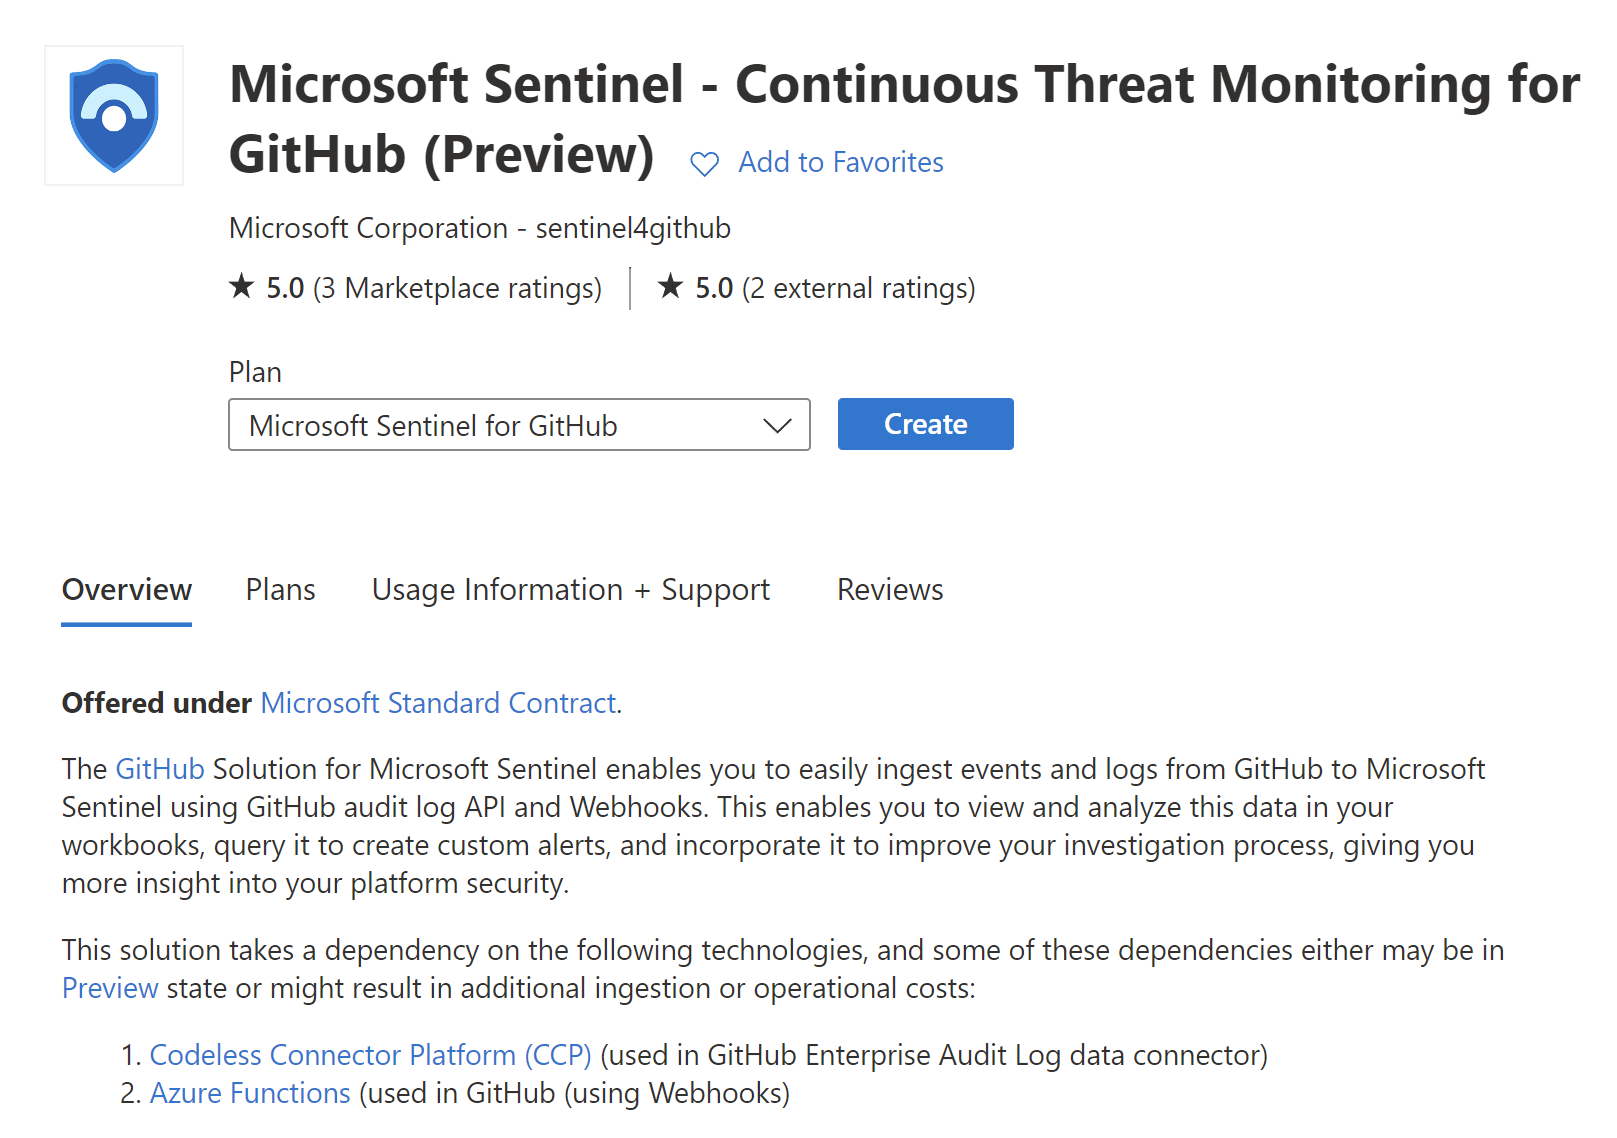
Together with the connector, the analytic rule templates are installed including:
- Oauth application - detect that a client secret was removed
- Detect activities when a repository was created.
- Detect activities when the repository was destroyed
Once we install the above, we have to configure it to properly connect with our GitHub organization.
*IMPORTANT - this connector works only with GitHub organizations with a GitHub Enterprise license.
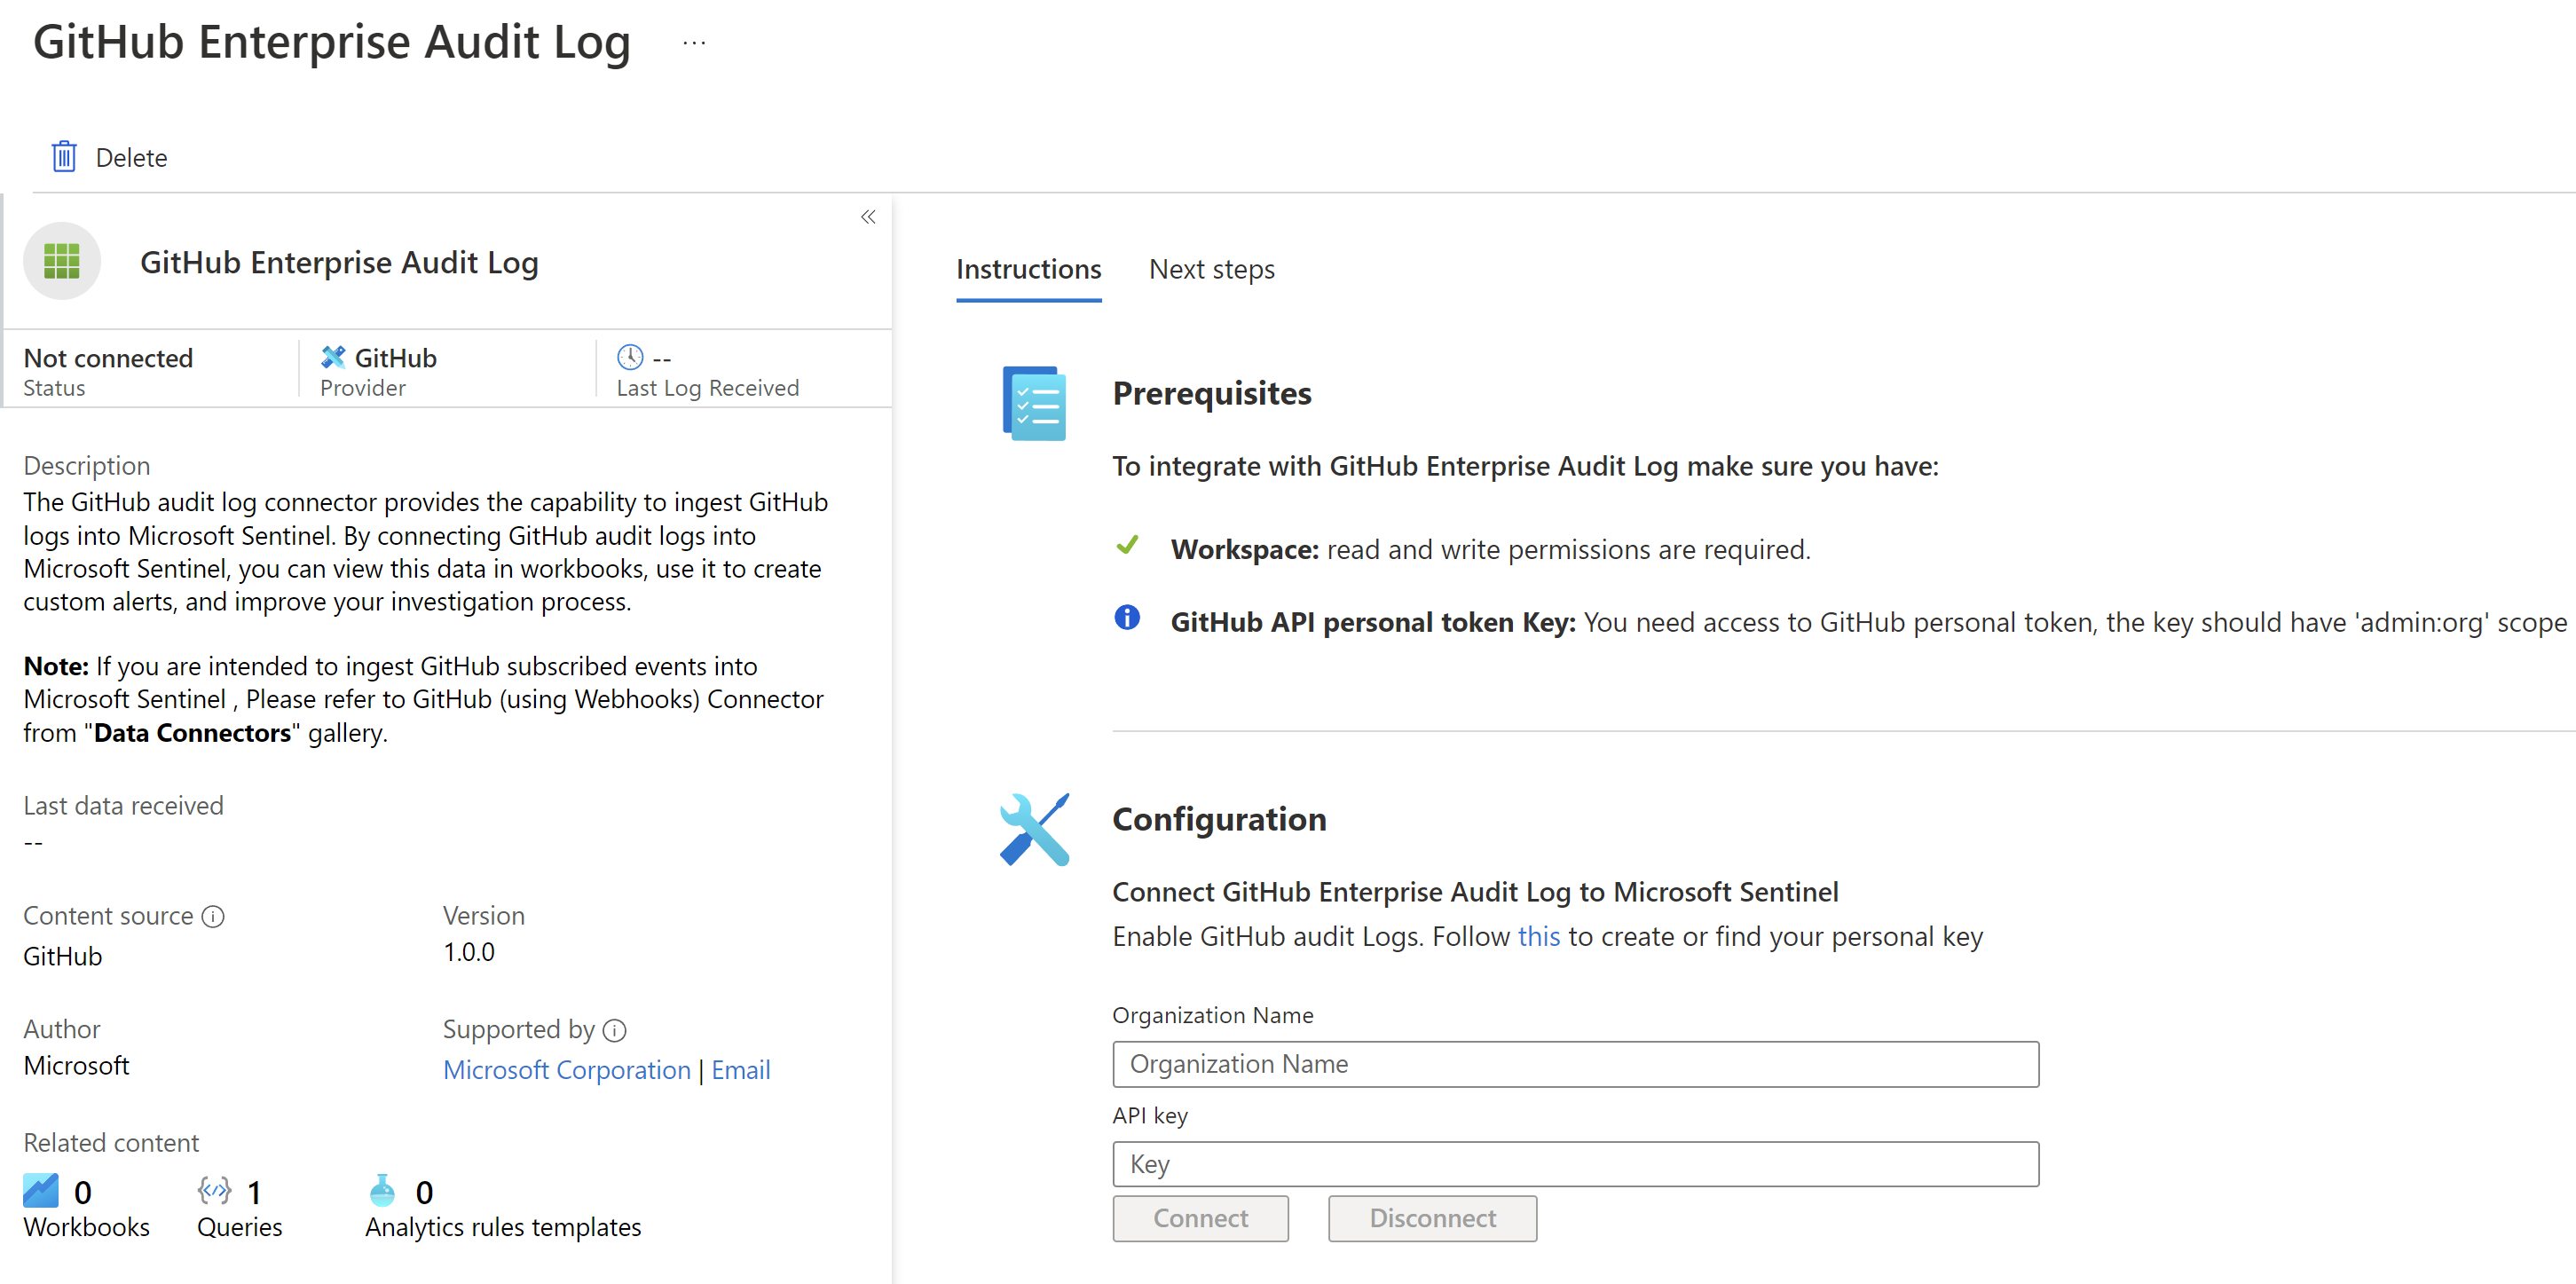
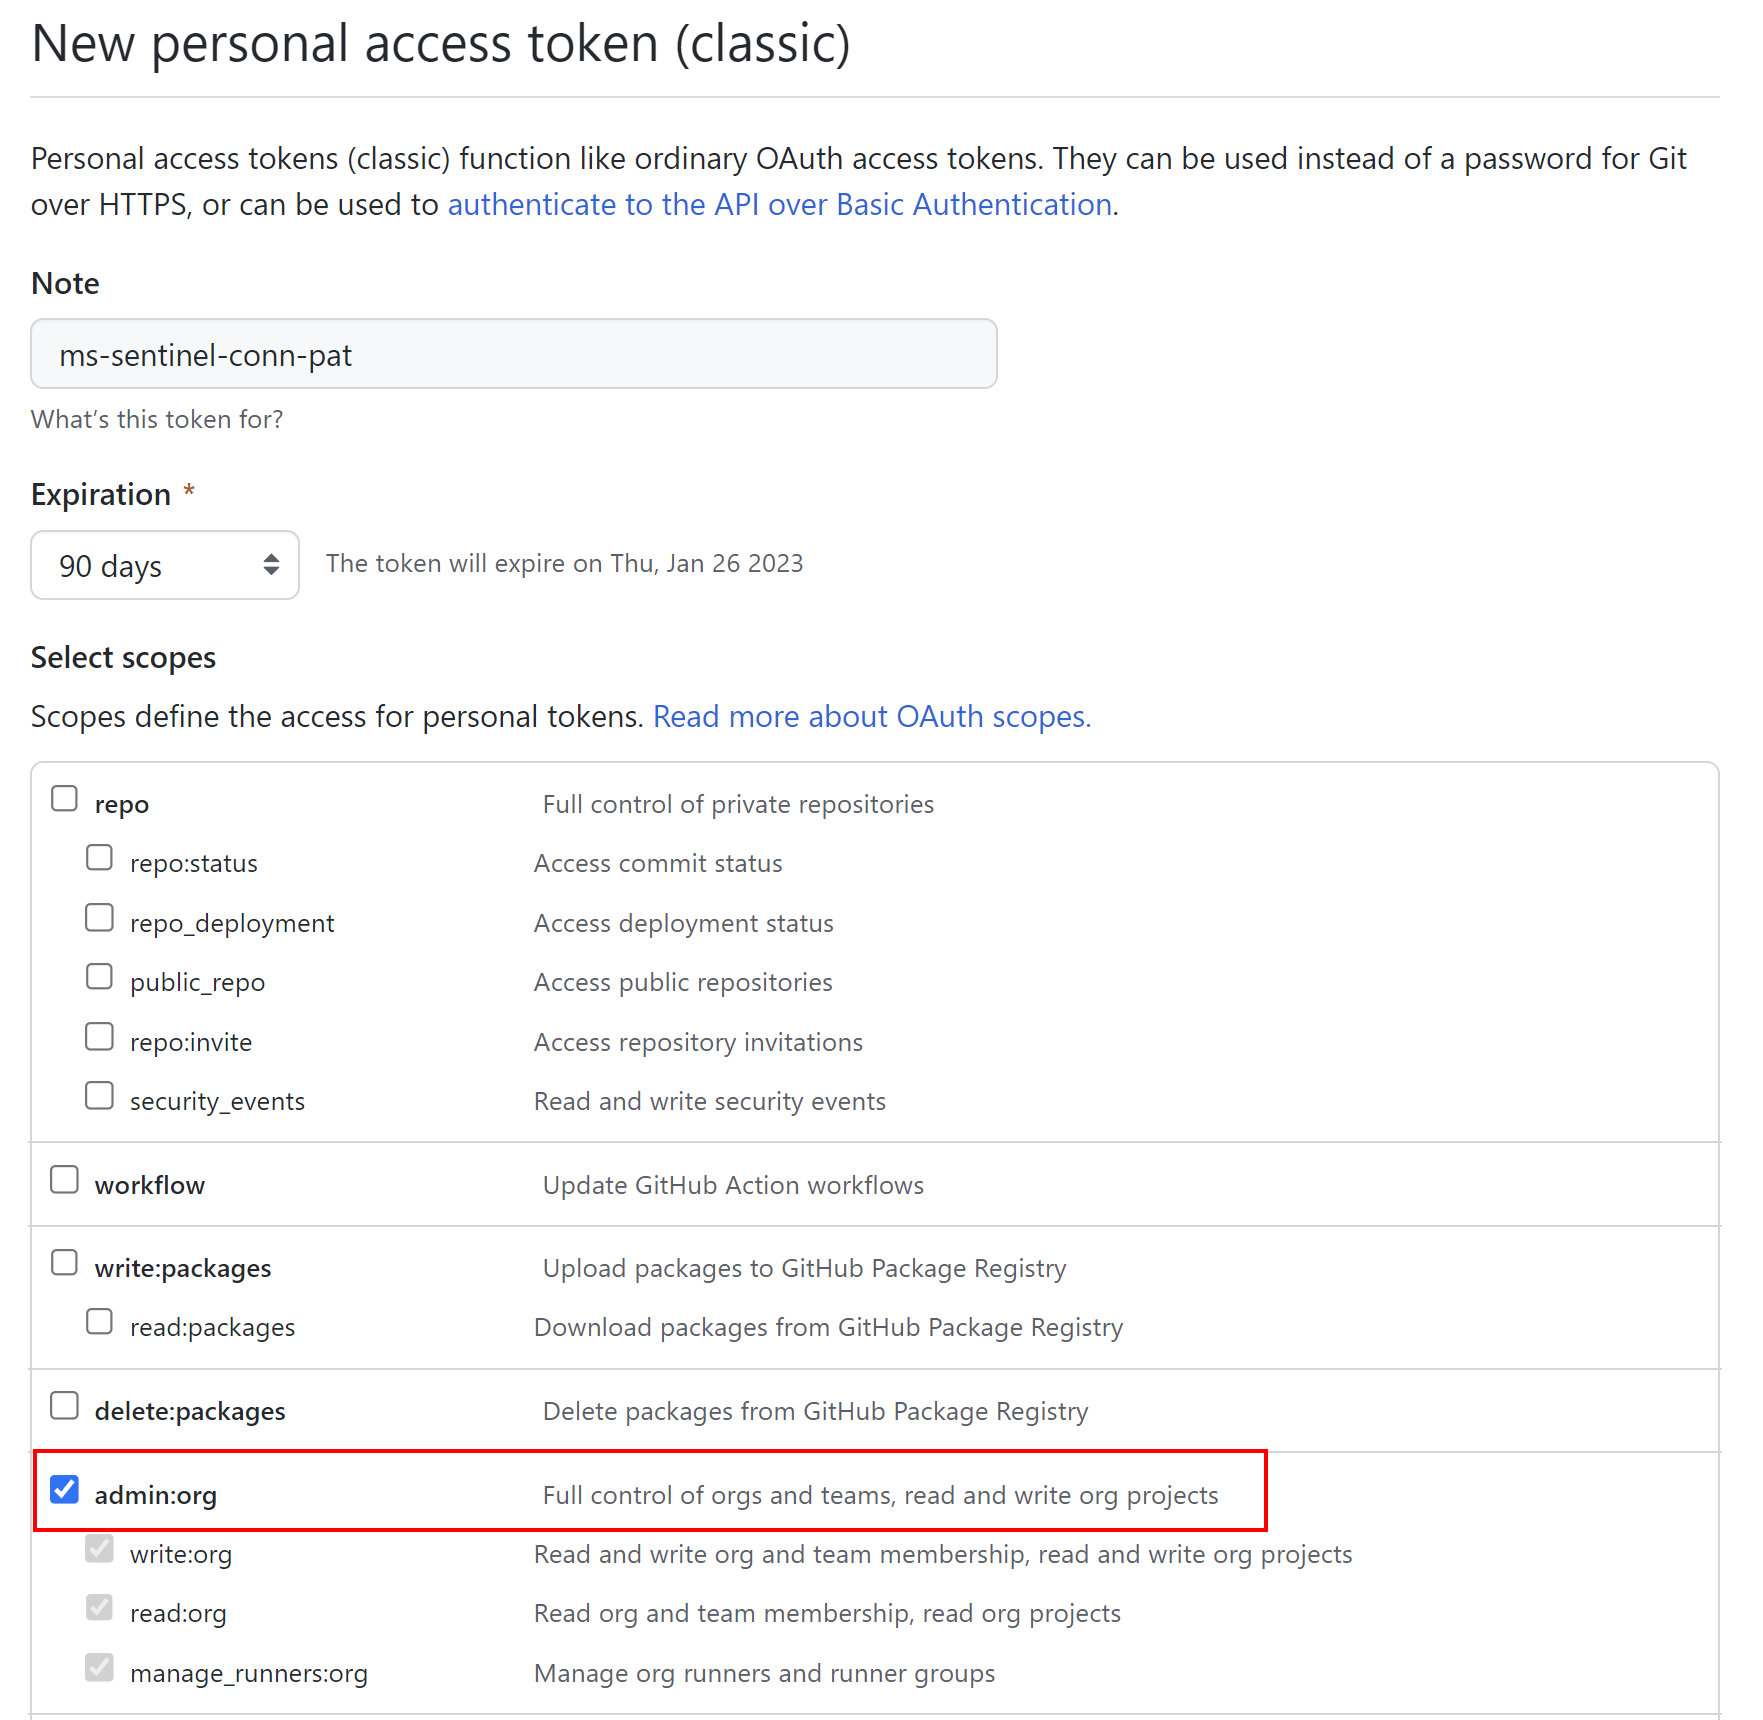
To connect with GitHub we have to provide the name of our organization together with Personal Access Token (PAT) with admin:org permission:

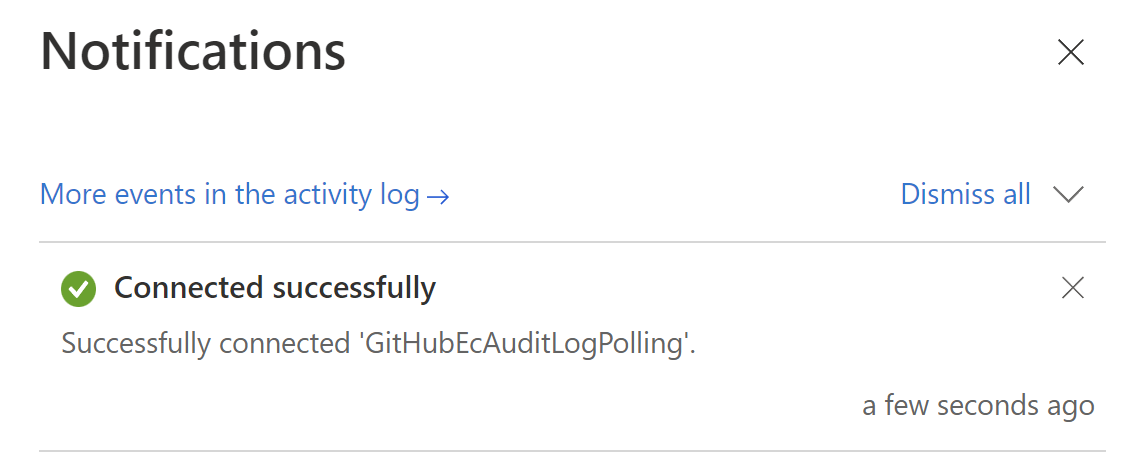
Once the connection is verified we should see confirmation in the Azure Portal:
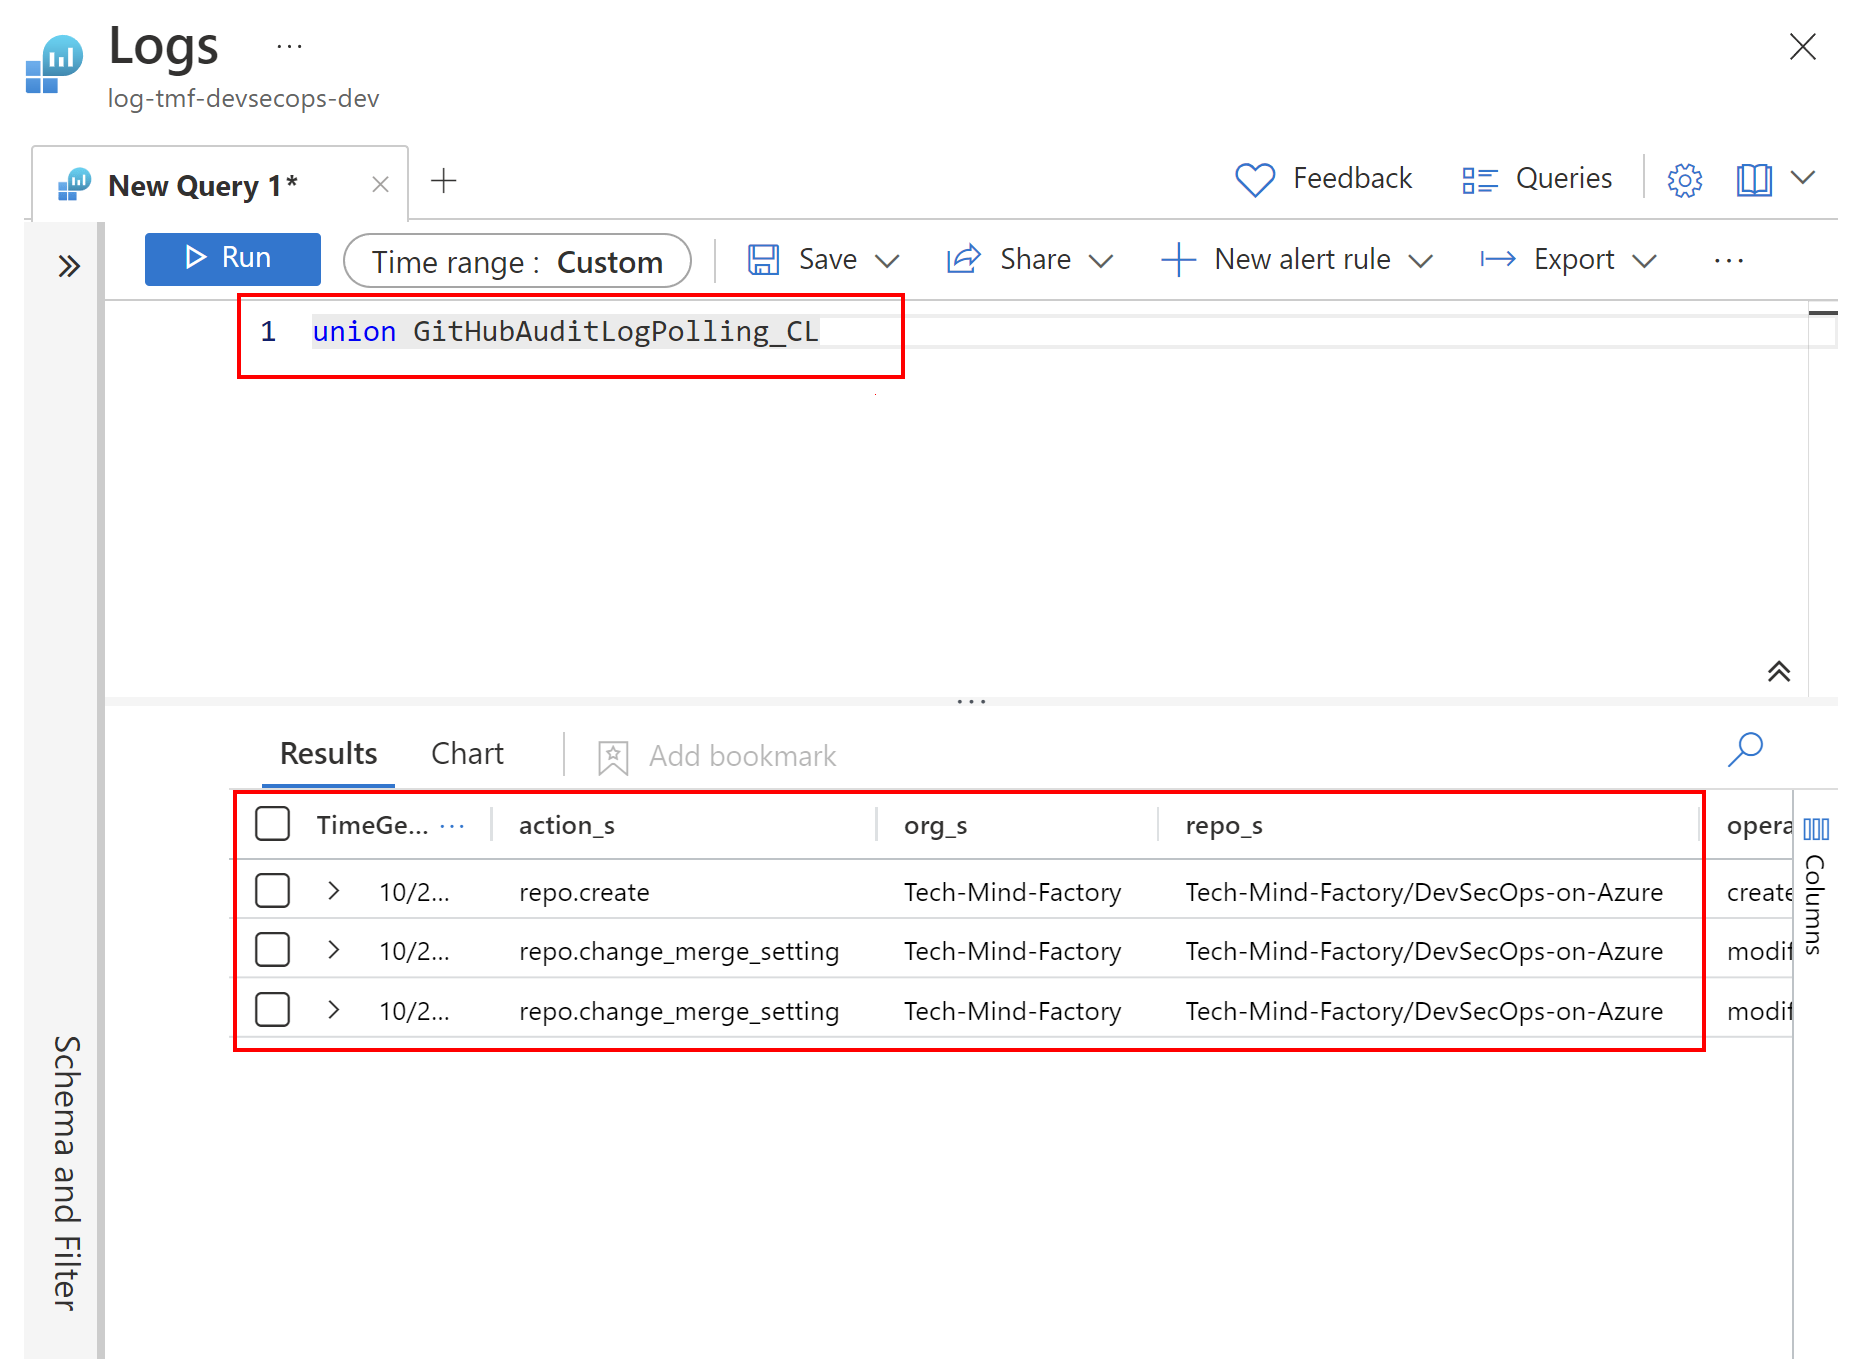
Logs should be able to see in the custom table called GitHubAuditLogPolling_CL after a few minutes:
Once we have data ingested, we can utilize the Workbook template provided by Microsoft:
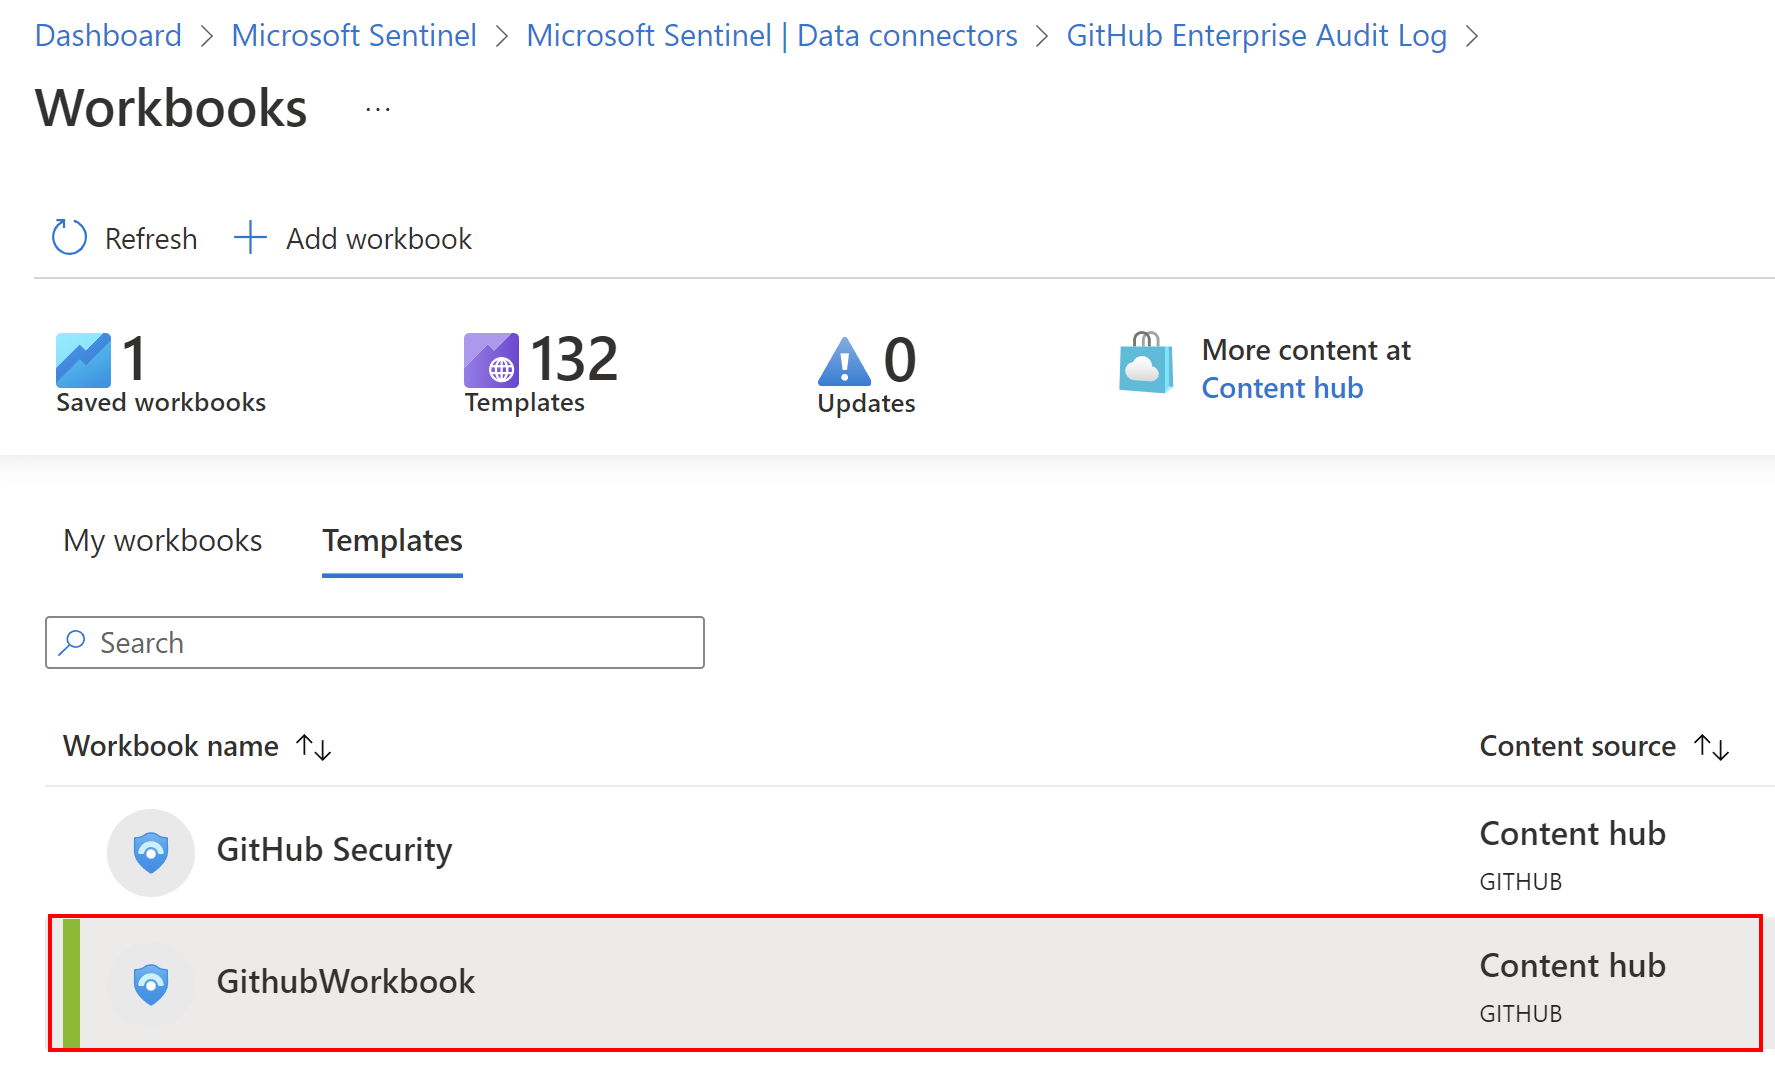
You can also ask about the above, second Workbook template called GitHub Security - it is used to display information about security events from organizations with GitHub Advanced Security Enabled.
Azure DevOps monitoring with Microsoft Sentinel
Azure DevOps can be also monitored with Microsoft Sentinel. First of all, we have to connect our Azure DevOps organization with Azure Active Directory. Why? Because without it we cannot enable audit logs which I will explain below.
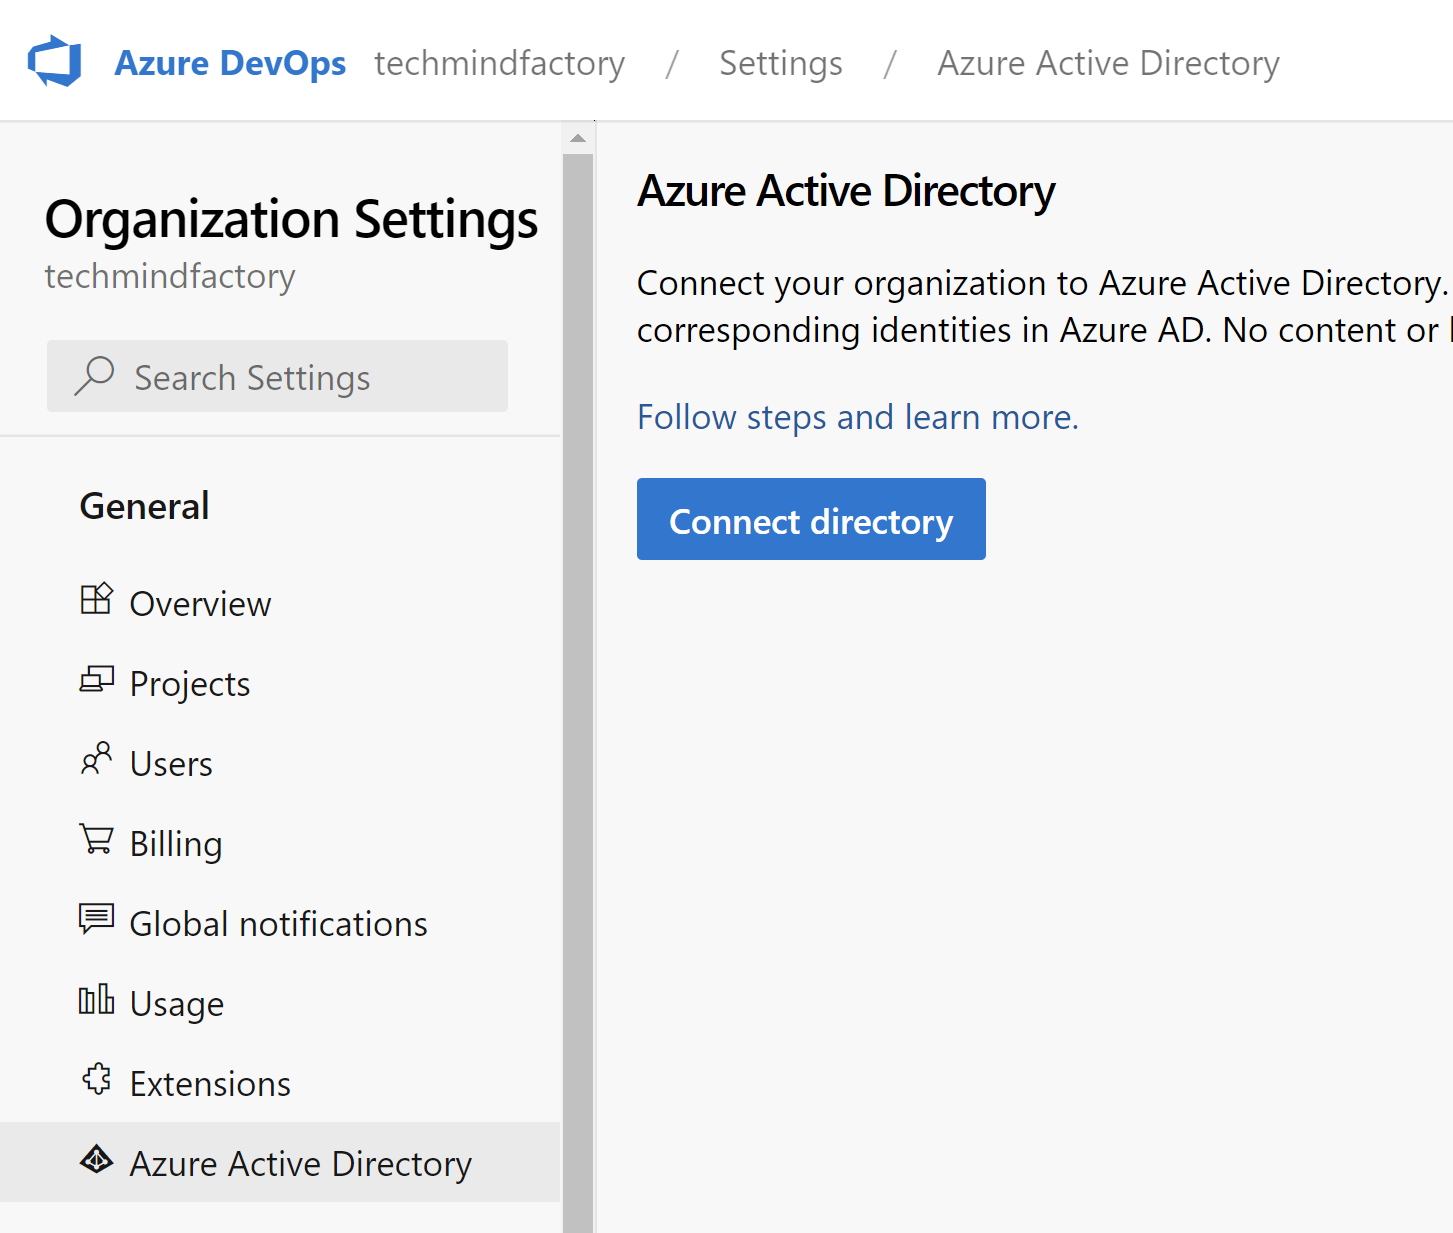
Once Azure AD is integrated, we can enable Audit Logs:
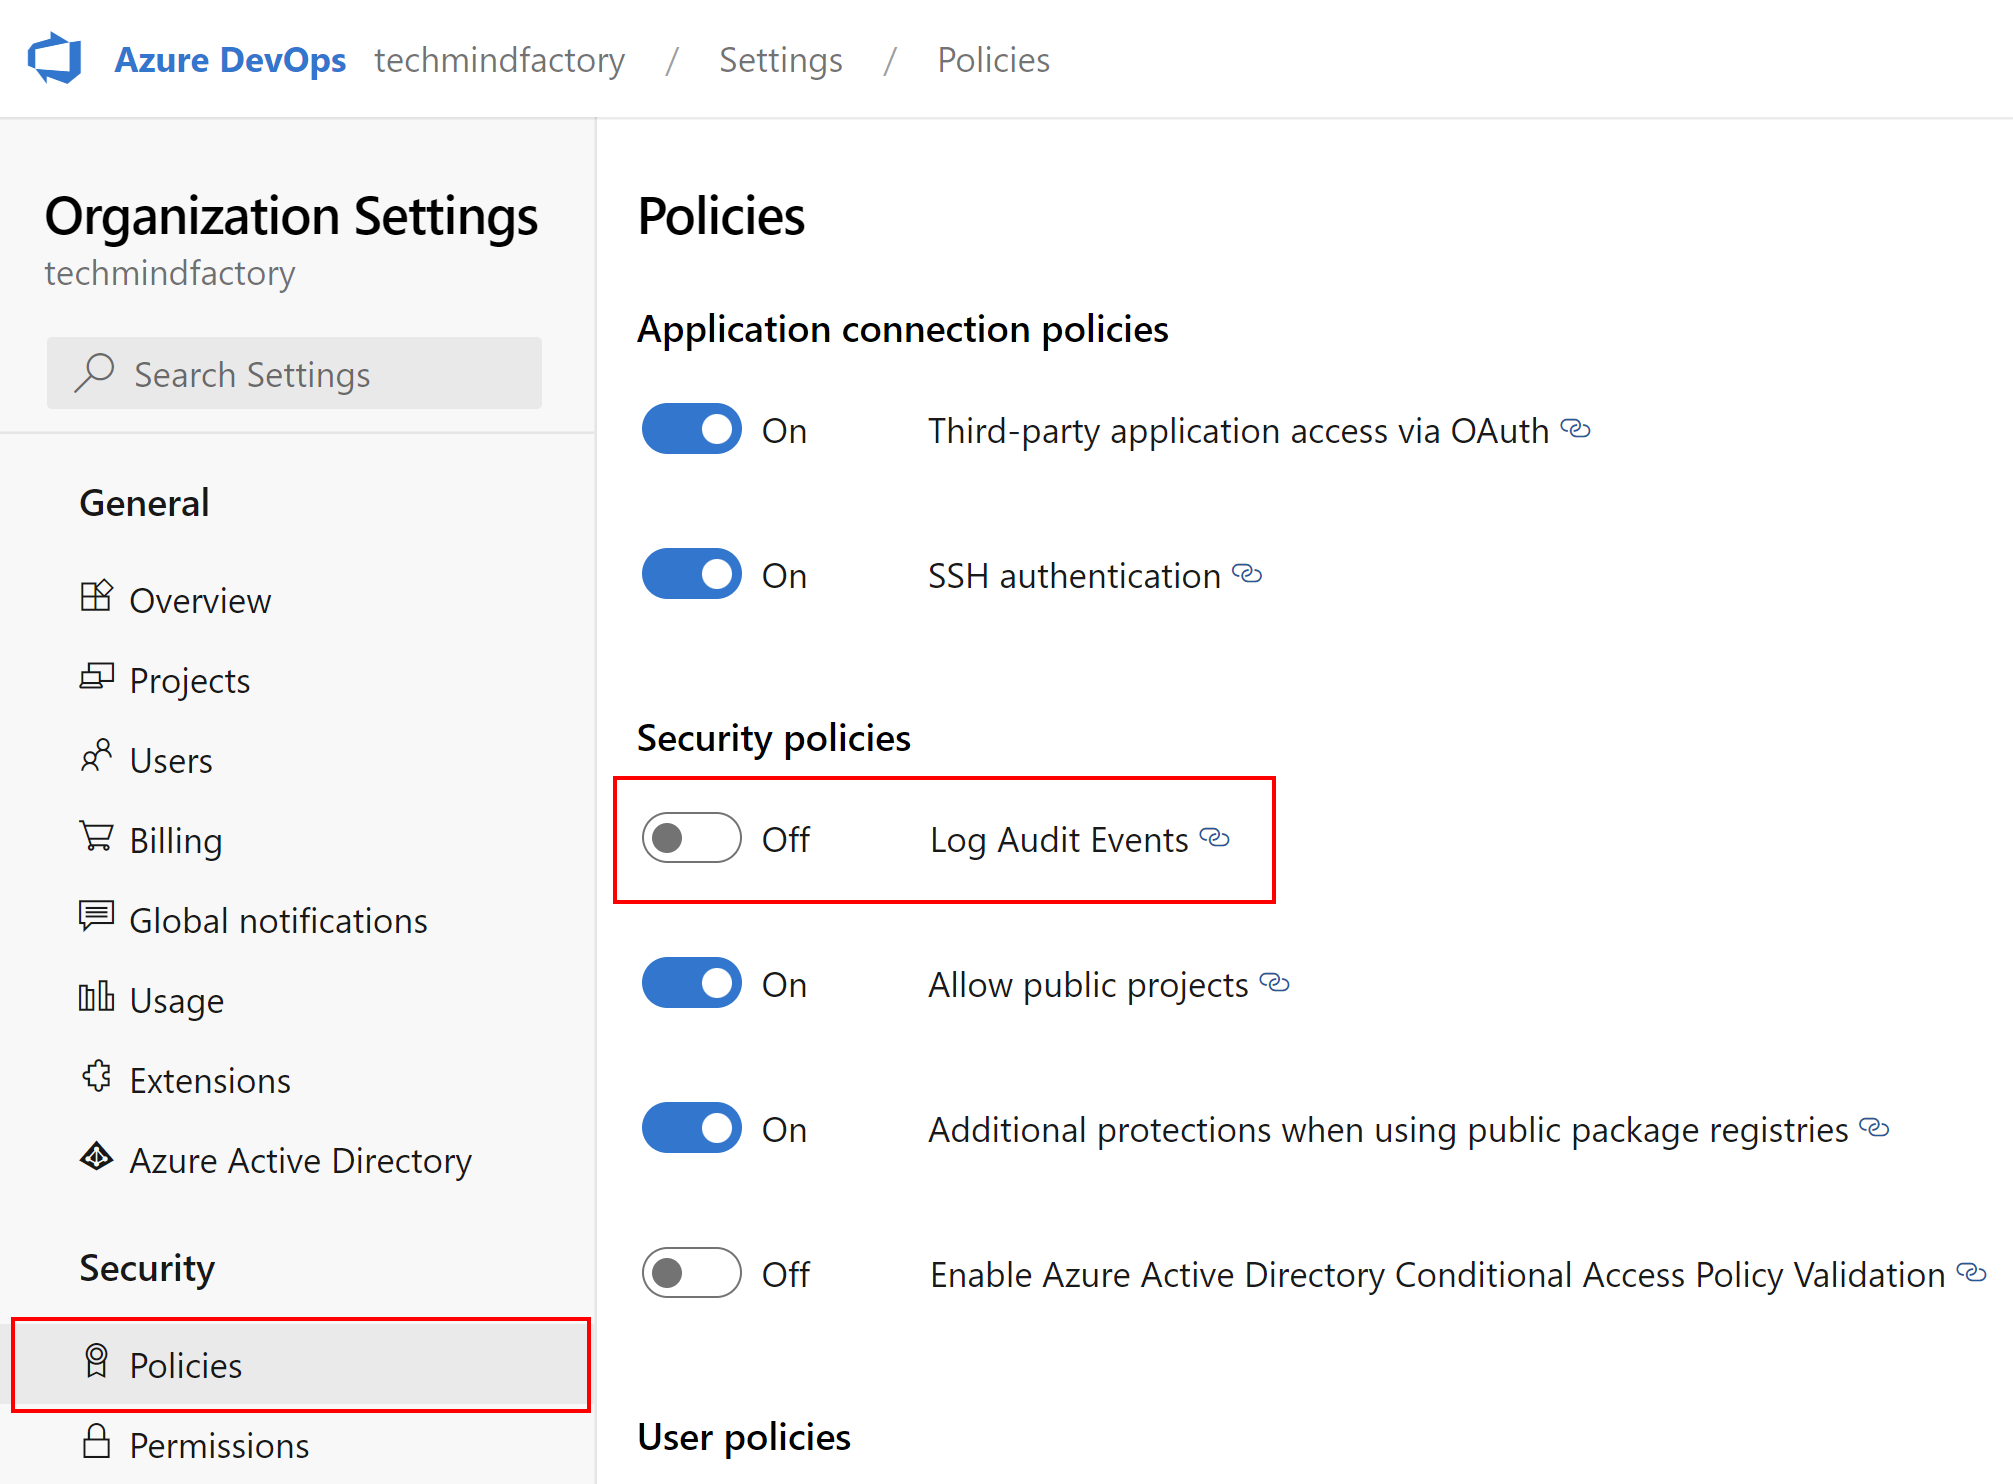
At the moment of writing this article, Azure DevOps Audit Logs functionality is in preview. You can read more here. With audit logs we can collect information like:
- Branch policy changes
- Variable secret not secured
- Azure DevOps Pipeline modified by a new user
Logs can be accessed under Auditing tab:
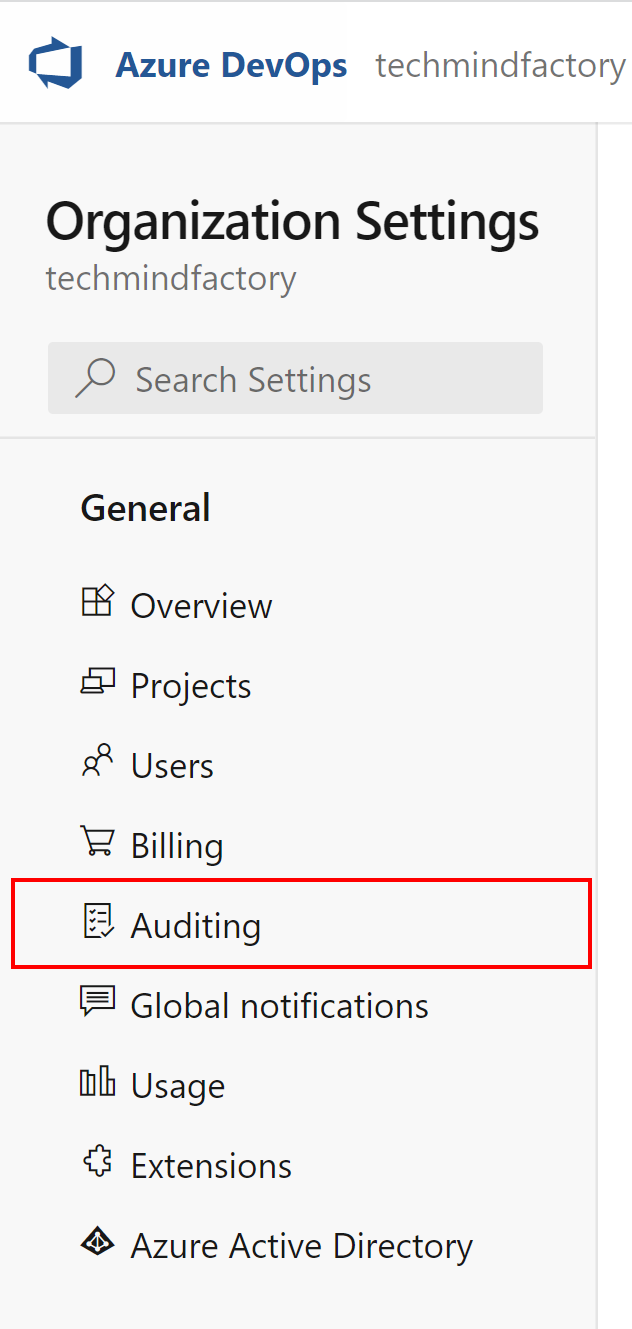
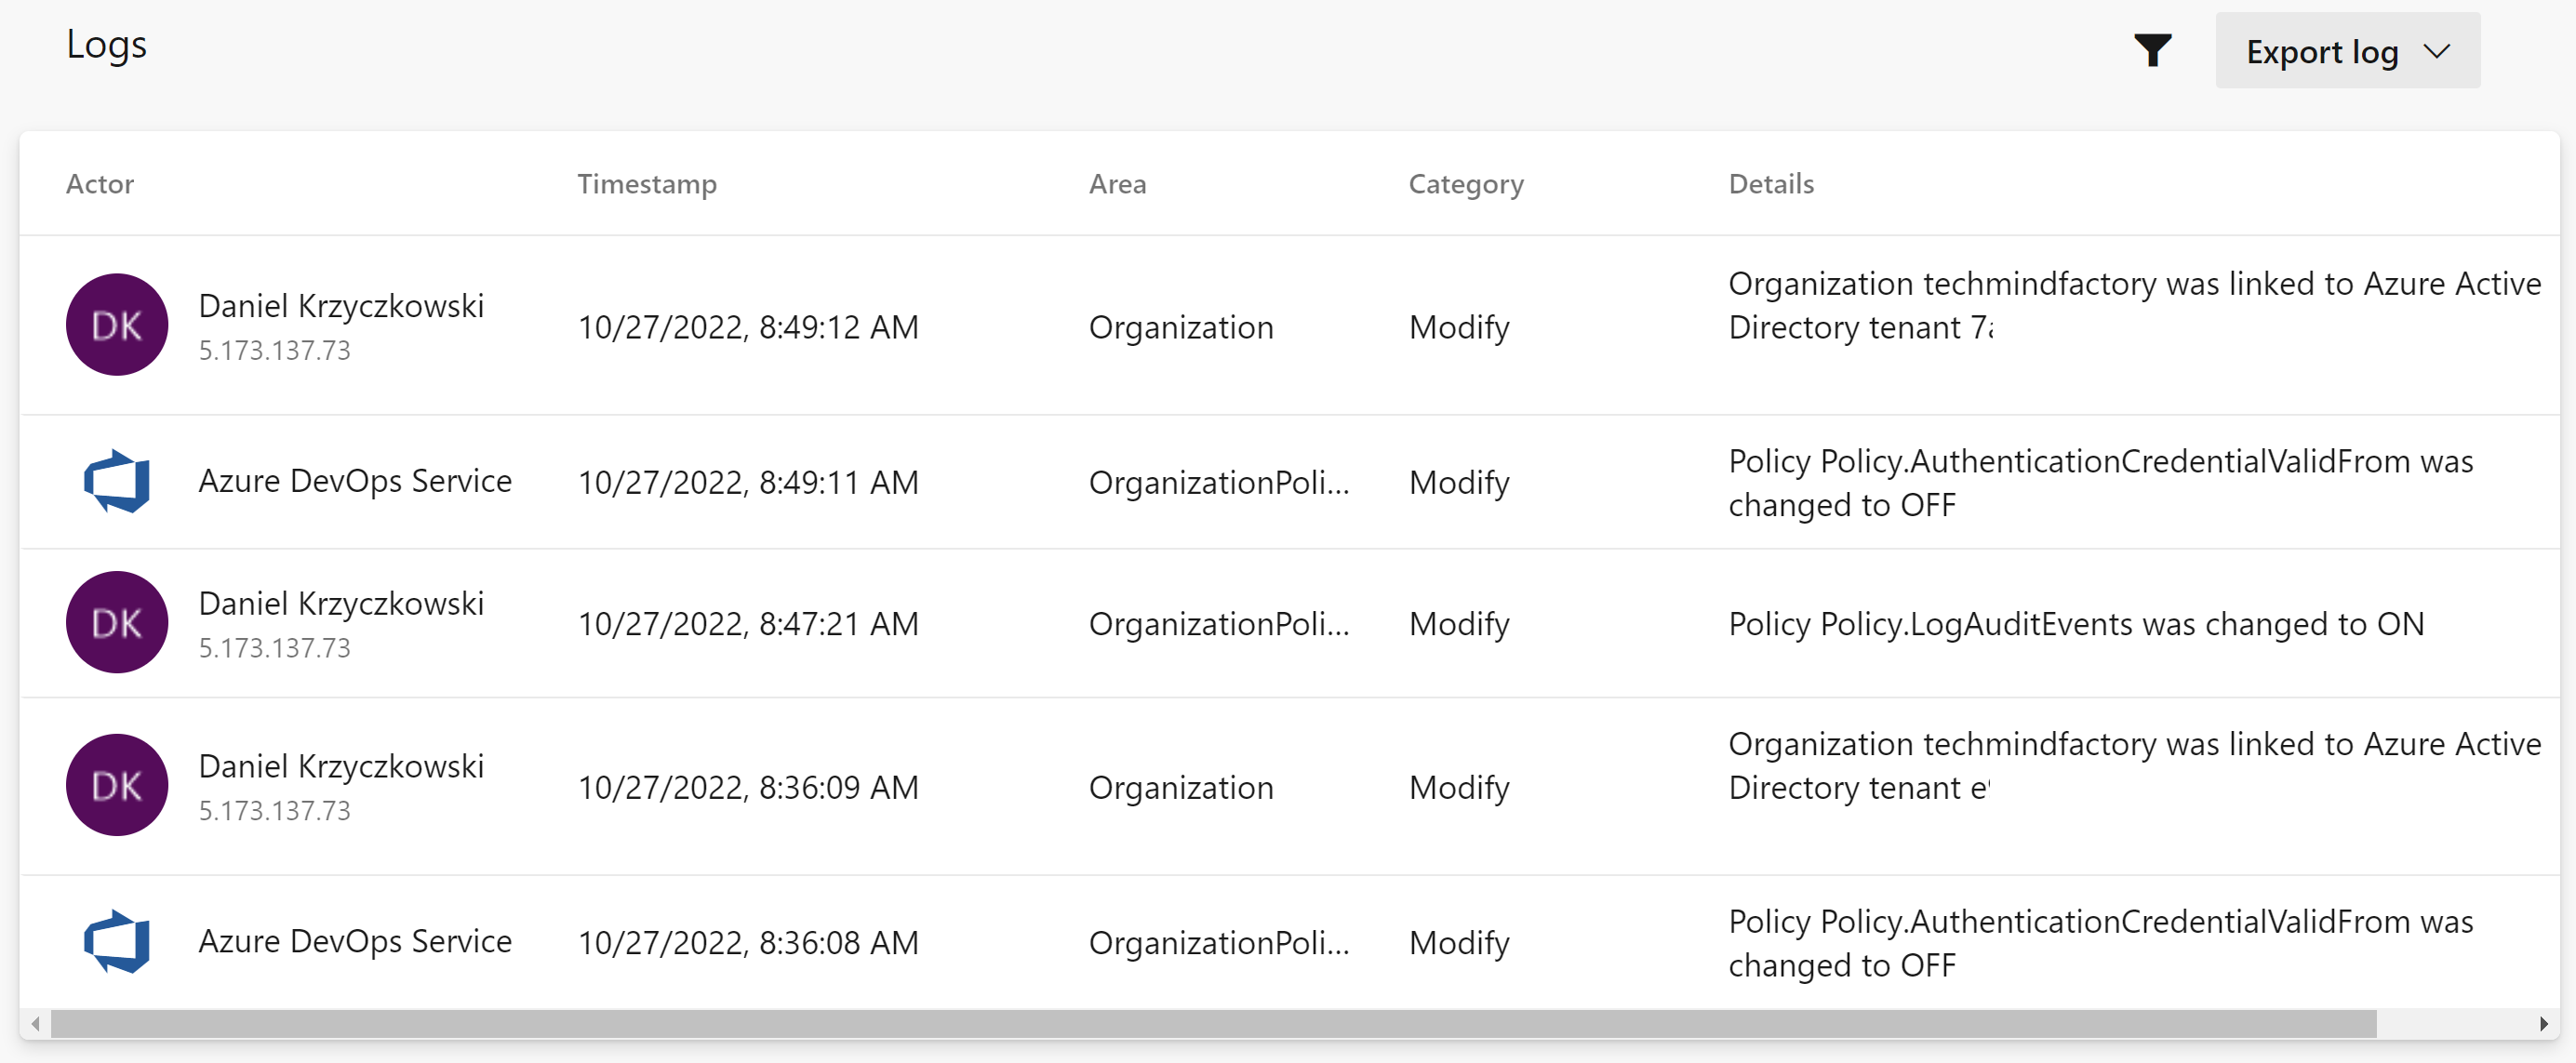
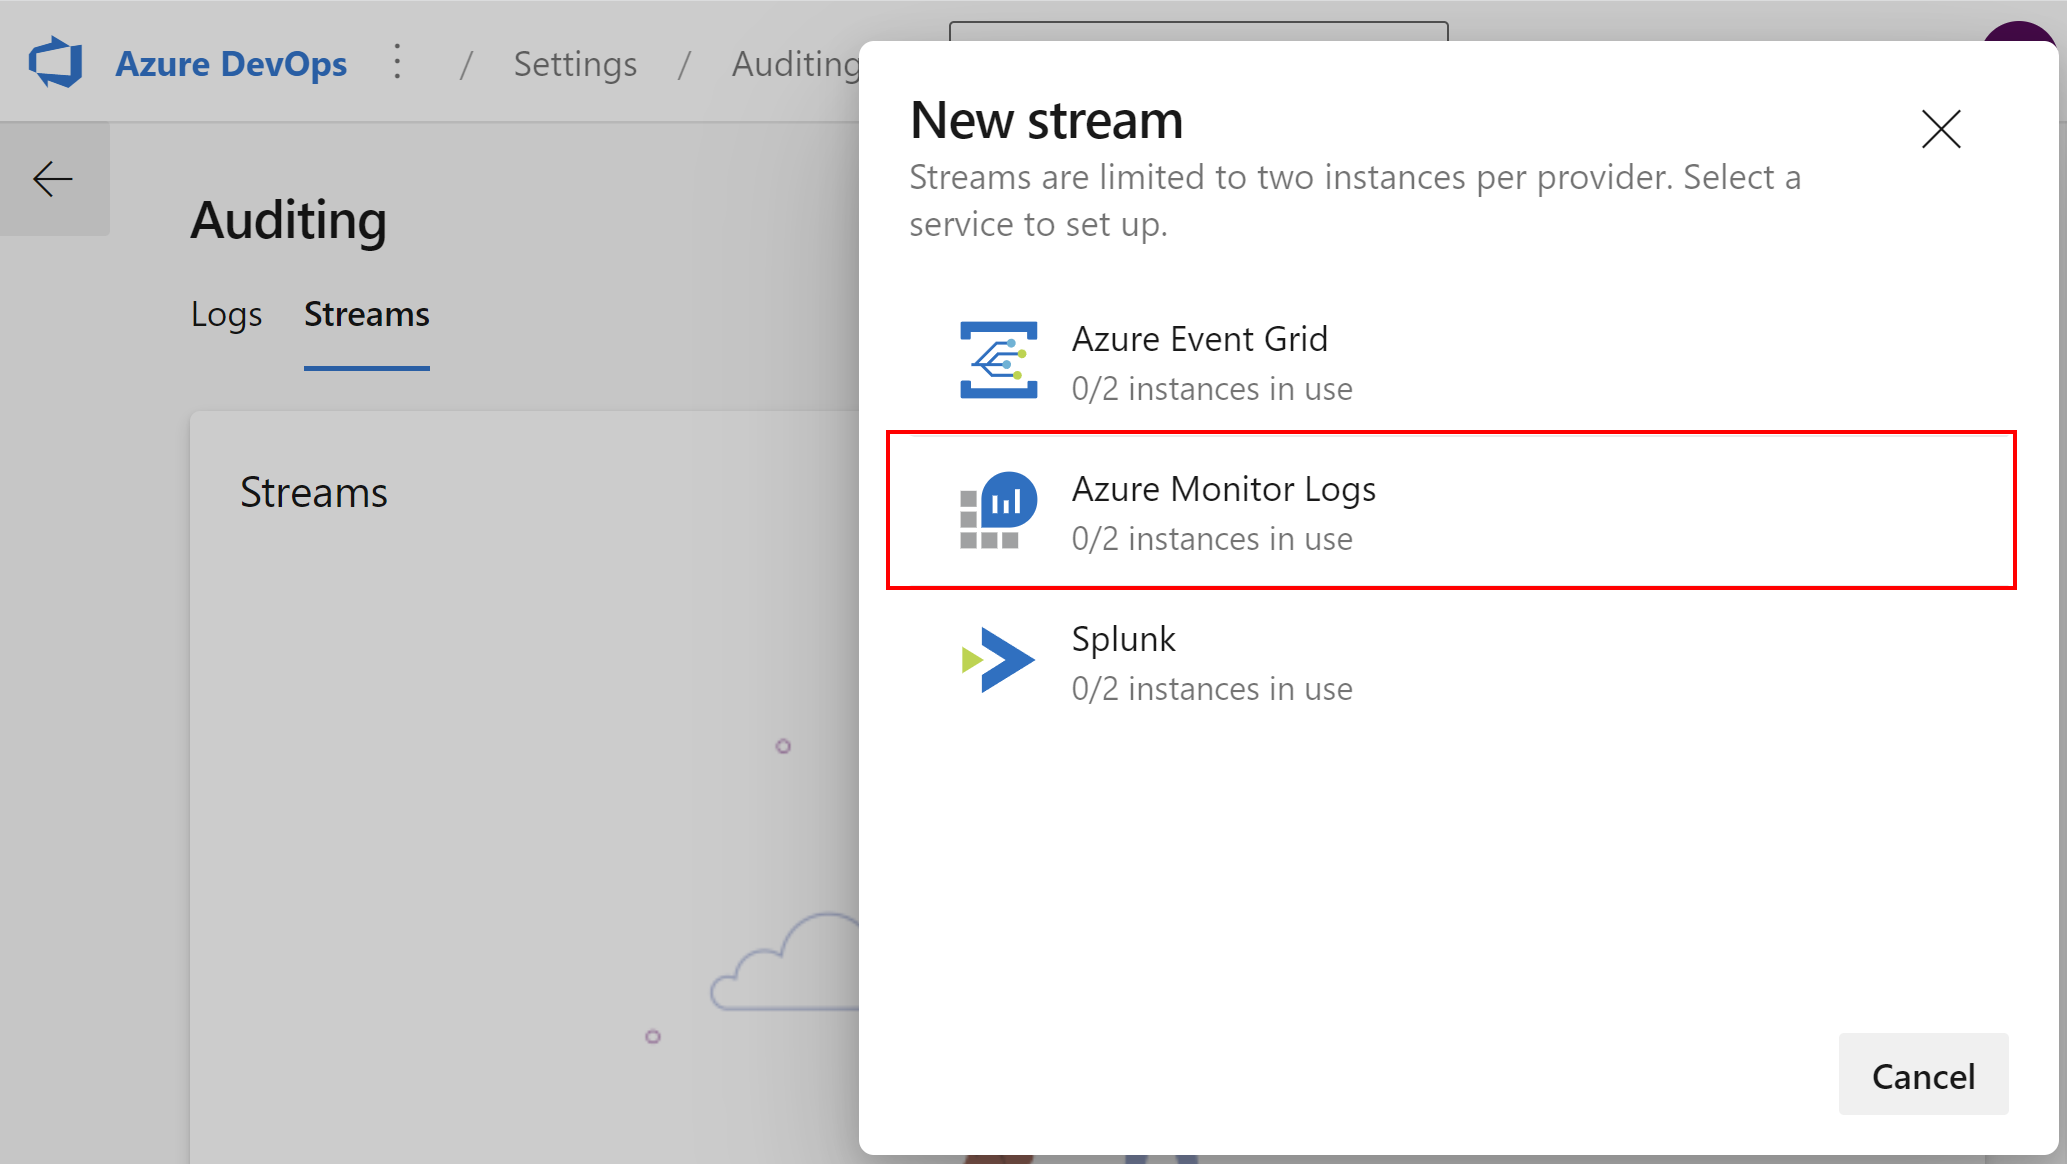
We have to ingest data to the Log Analytics Workspace connected to Microsoft Sentinel. To do it, we can easily configure a connection with our Log Analytics Workspace:
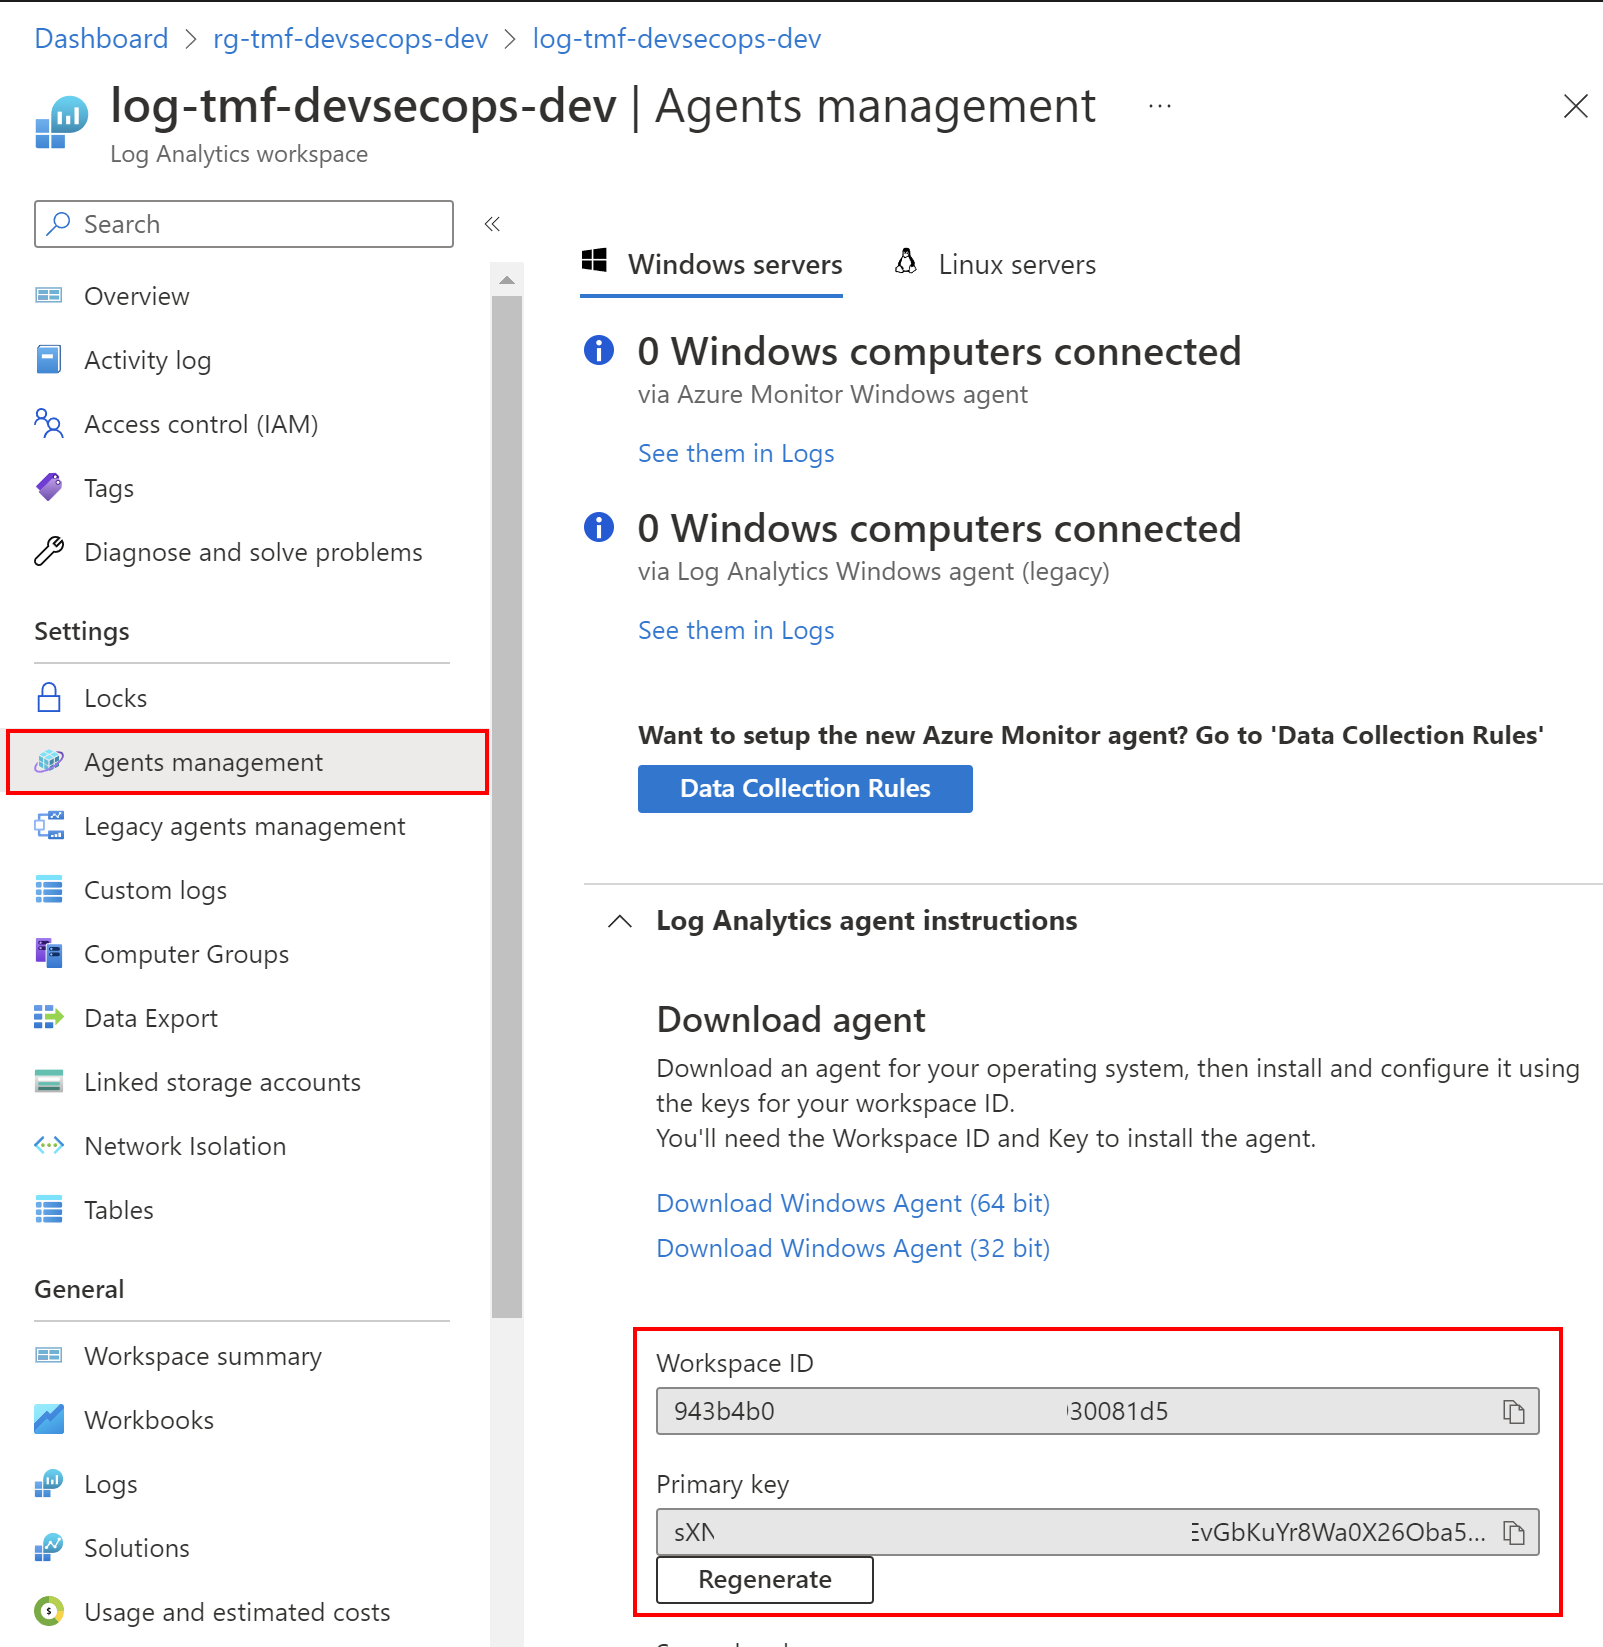
We need Workspace ID and Primary key values which can be found in the Azure Portal:
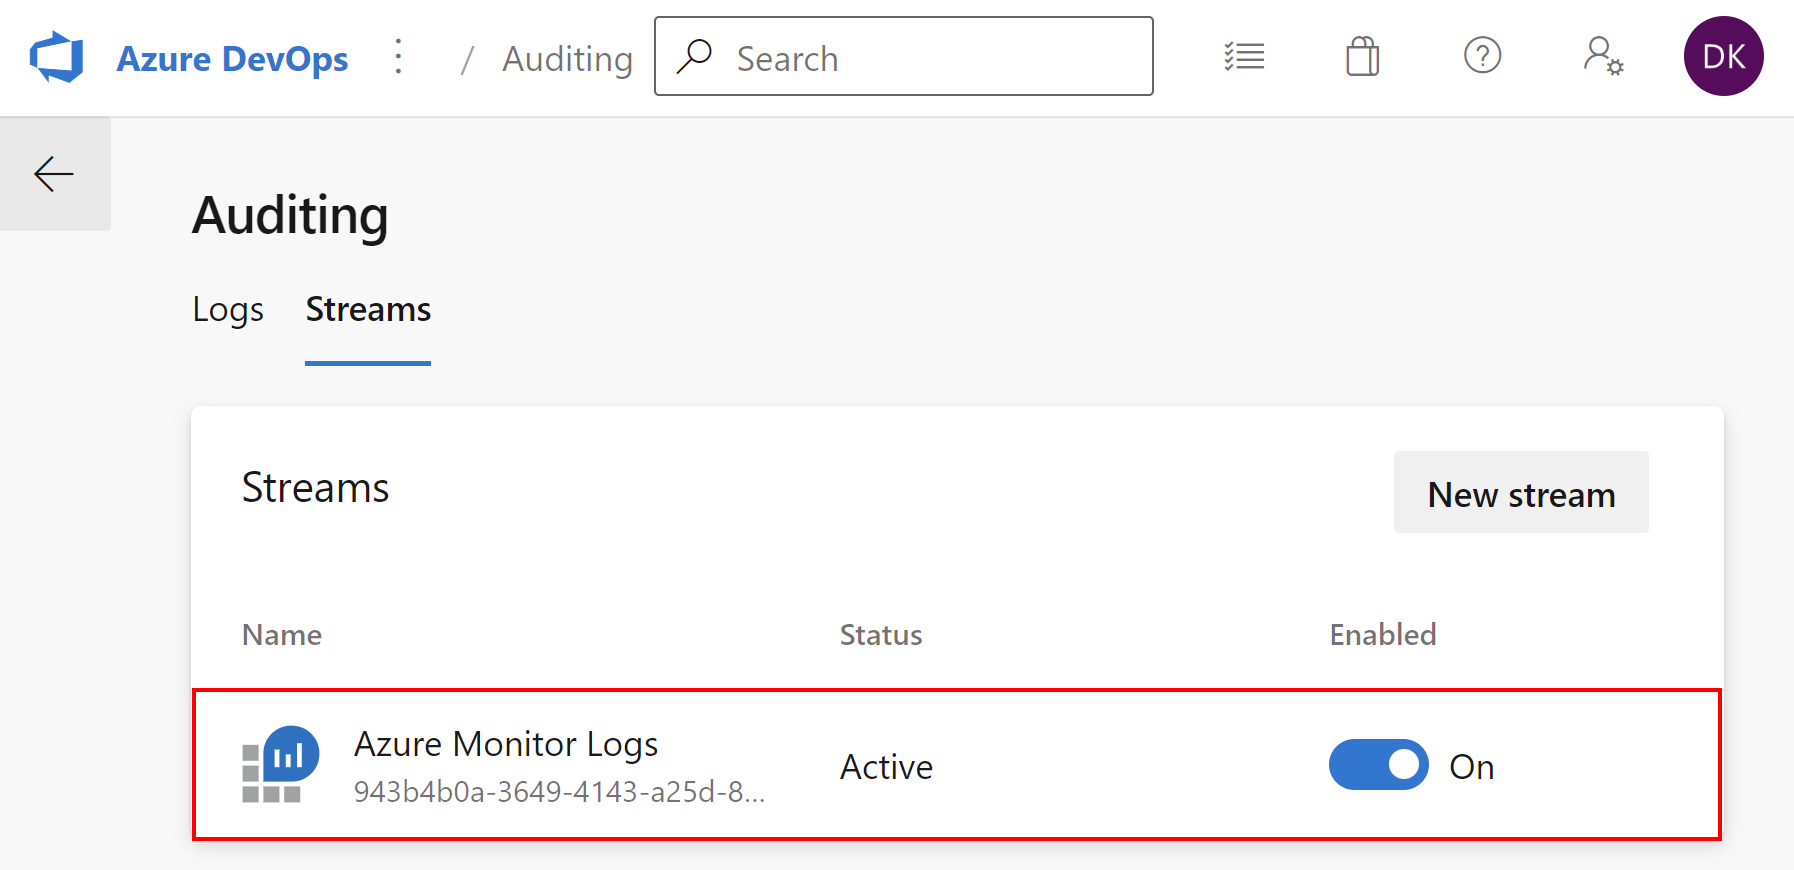
Once we connect, the logs stream is visible in Azure DevOps:
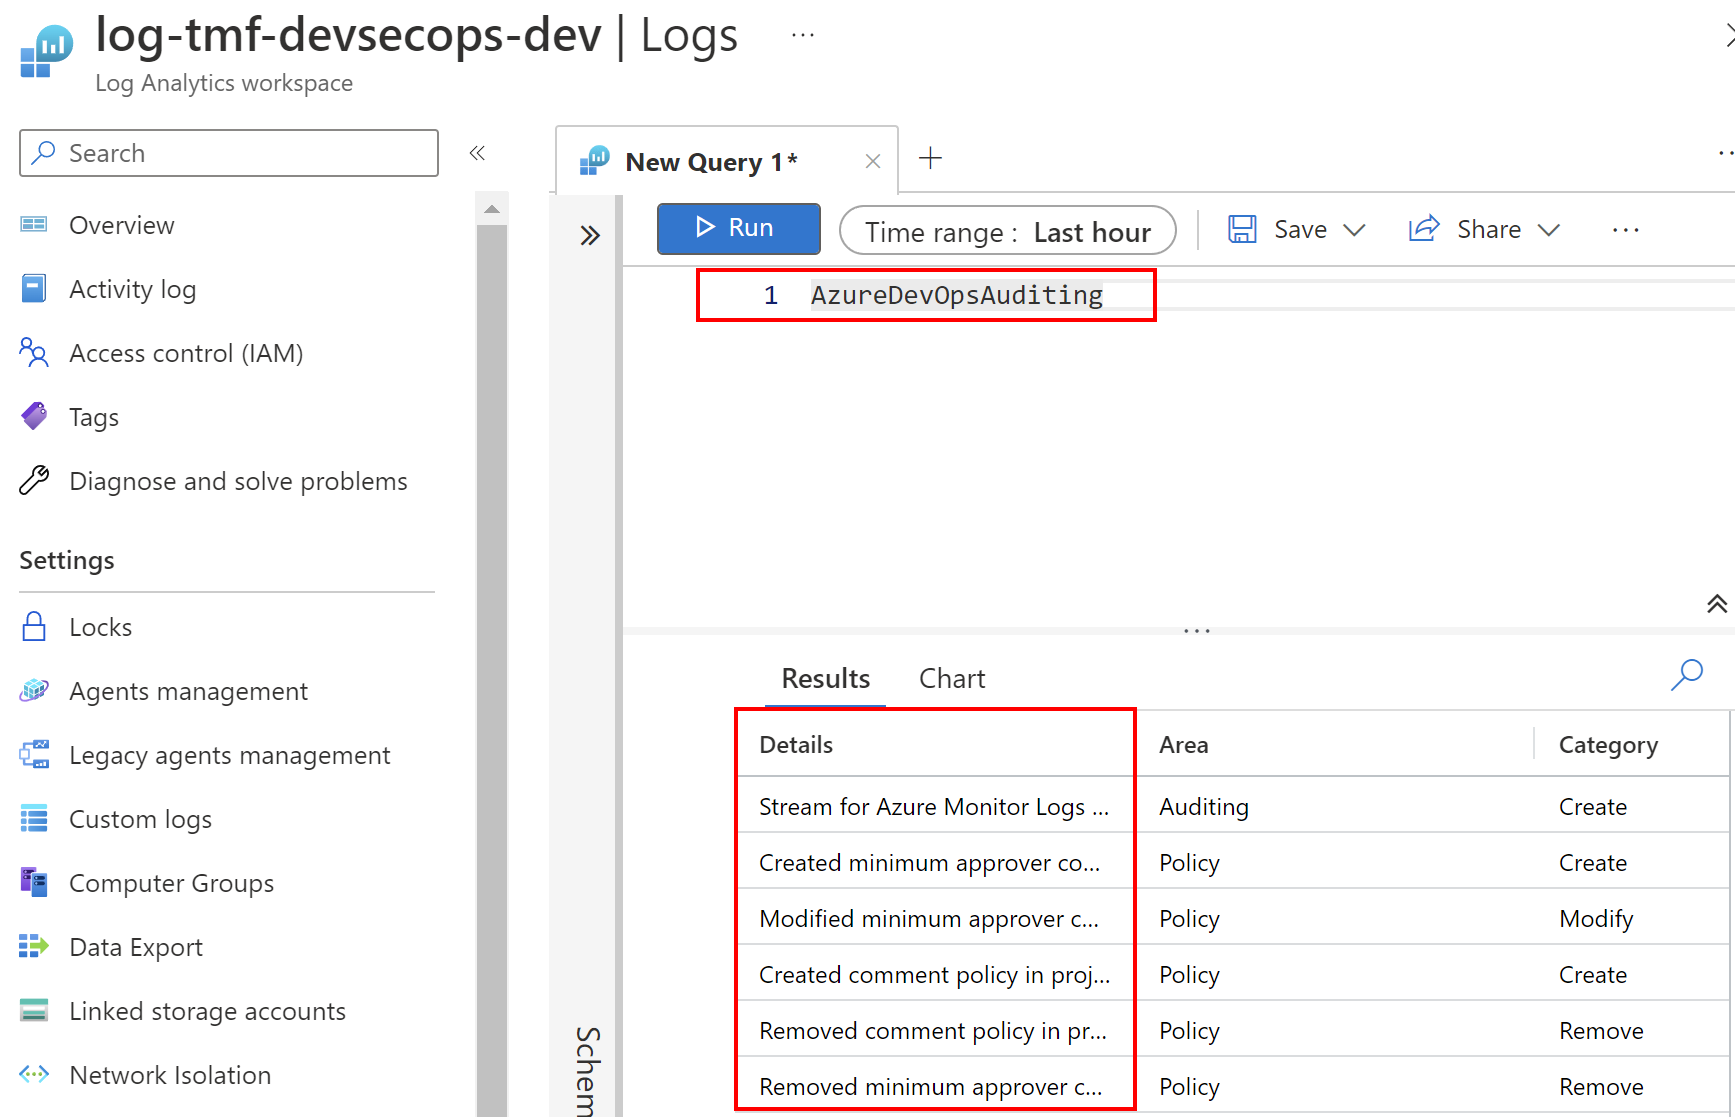
Once we wait a few minutes, logs should be available for us to investigate:
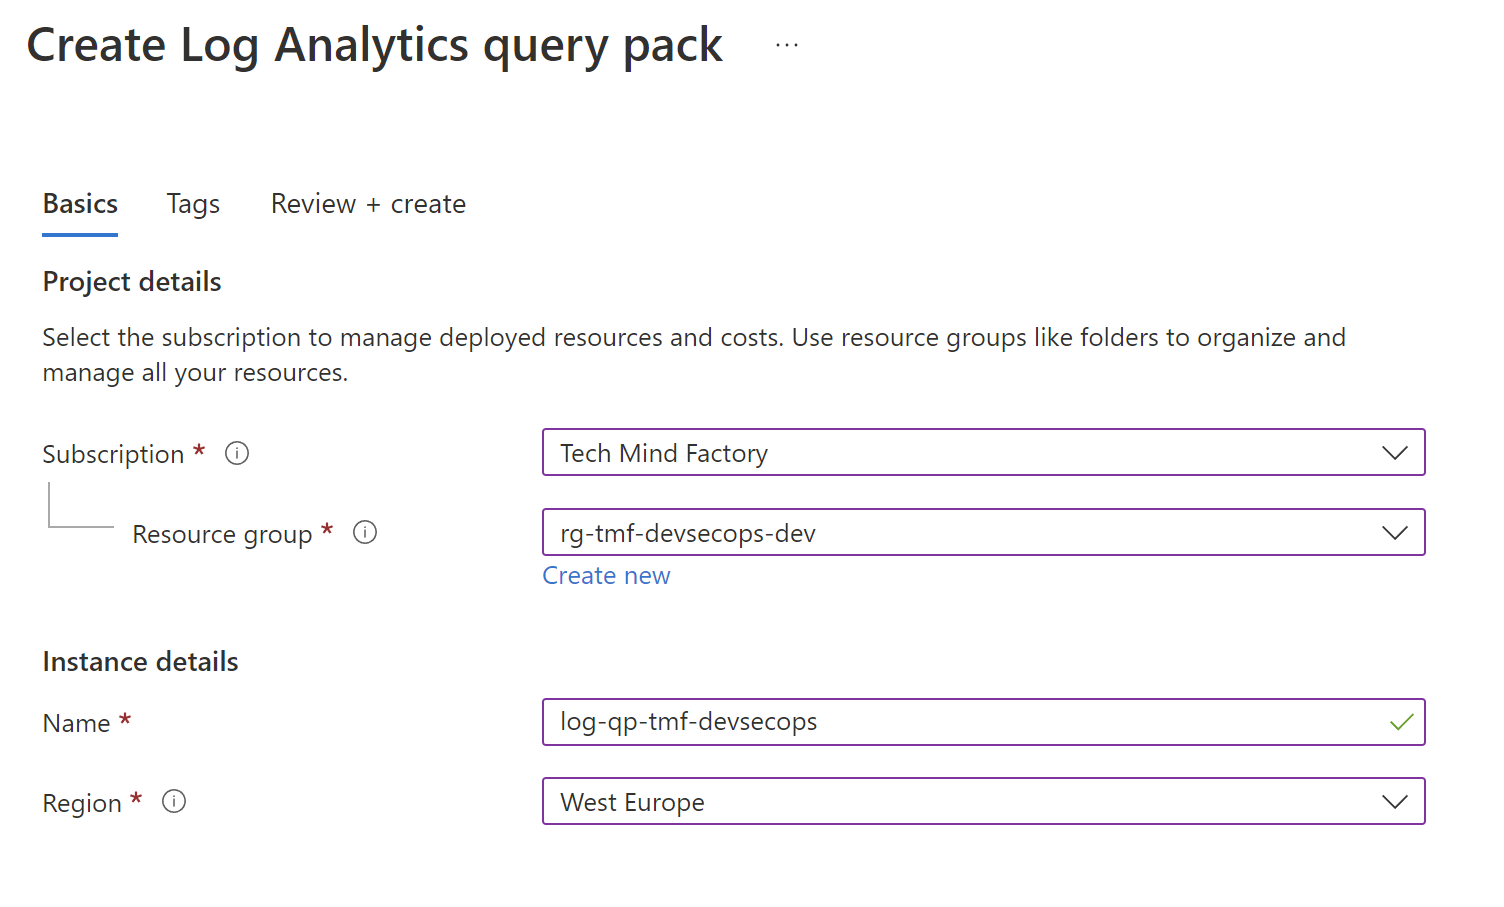
To aggregate queries together, I created a dedicated Log Analytics Query Pack:
Then I created a dedicated query for each log type. For tests I created three queries:


Here is the code for each query:
Get Removed Branch Policies
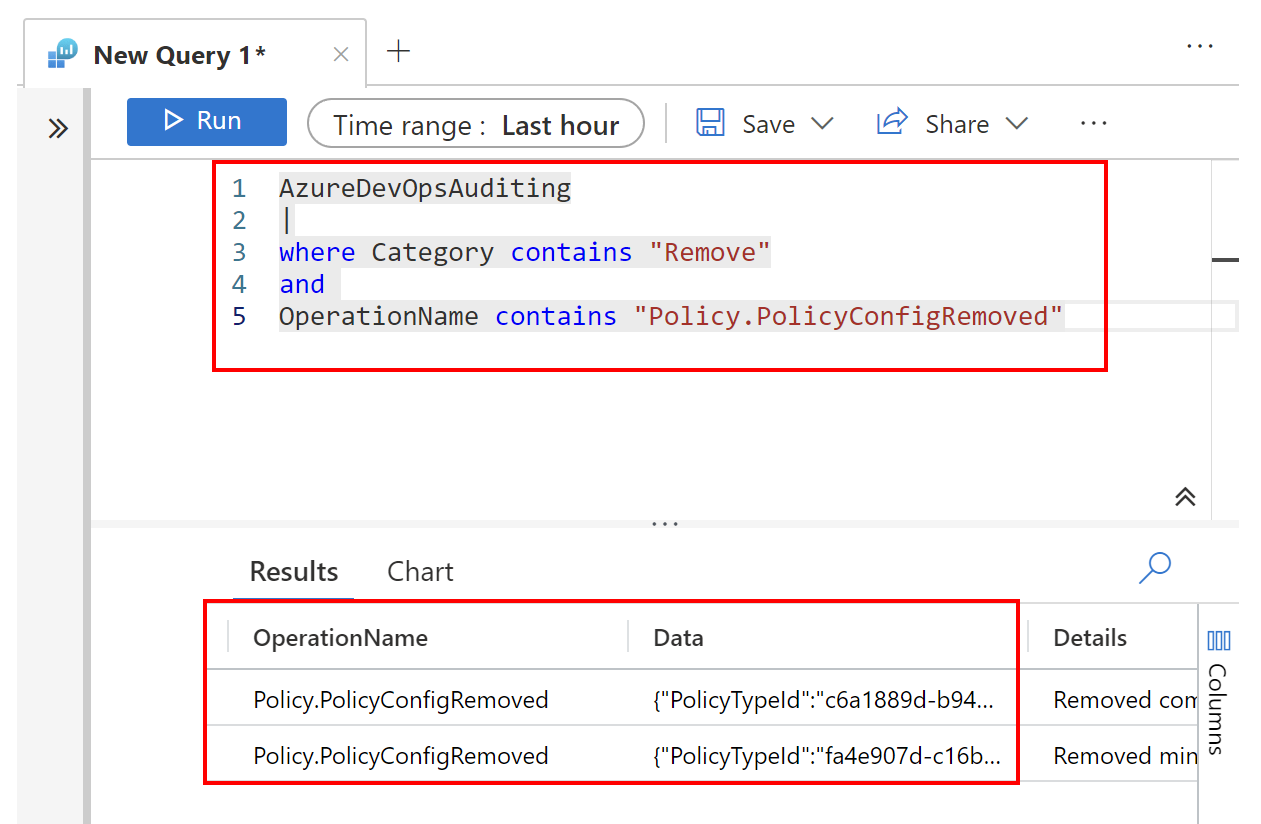
This query gets all the logs for removed branch policies for the Azure DevOps GIT repository:
AzureDevOpsAuditing
|
where Category contains "Remove"
and
OperationName contains "Policy.PolicyConfigRemoved"
Get Modified Variable Groups
This query gets all modified variable groups in Azure DevOps:
AzureDevOpsAuditing
|
where Category contains "Modify"
and
OperationName contains "Library.VariableGroupModified"
Get Installed Extensions
This query gets information about installed extensions in Azure DevOps:
AzureDevOpsAuditing
|
where Category contains "Create"
and
OperationName contains "Extension.Installed"
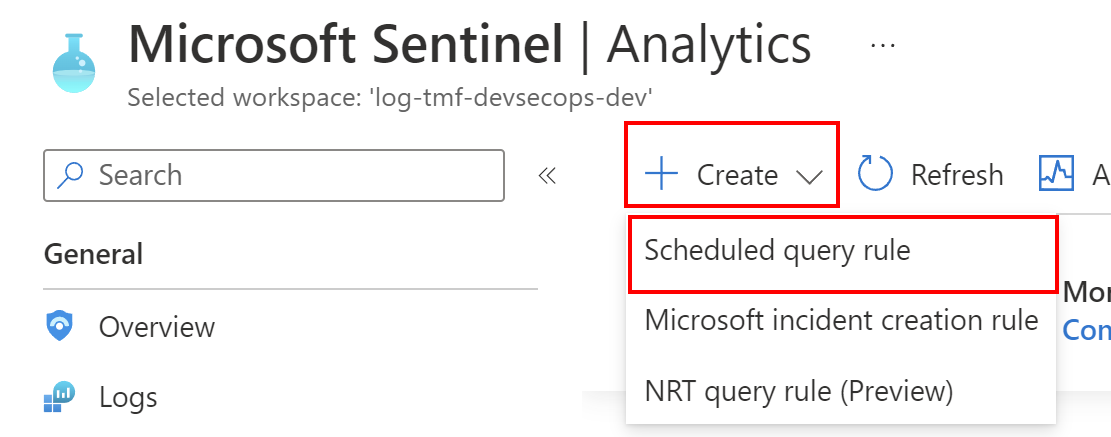
Next, based on the above queries, I was able to create scheduled Analytics Rules:
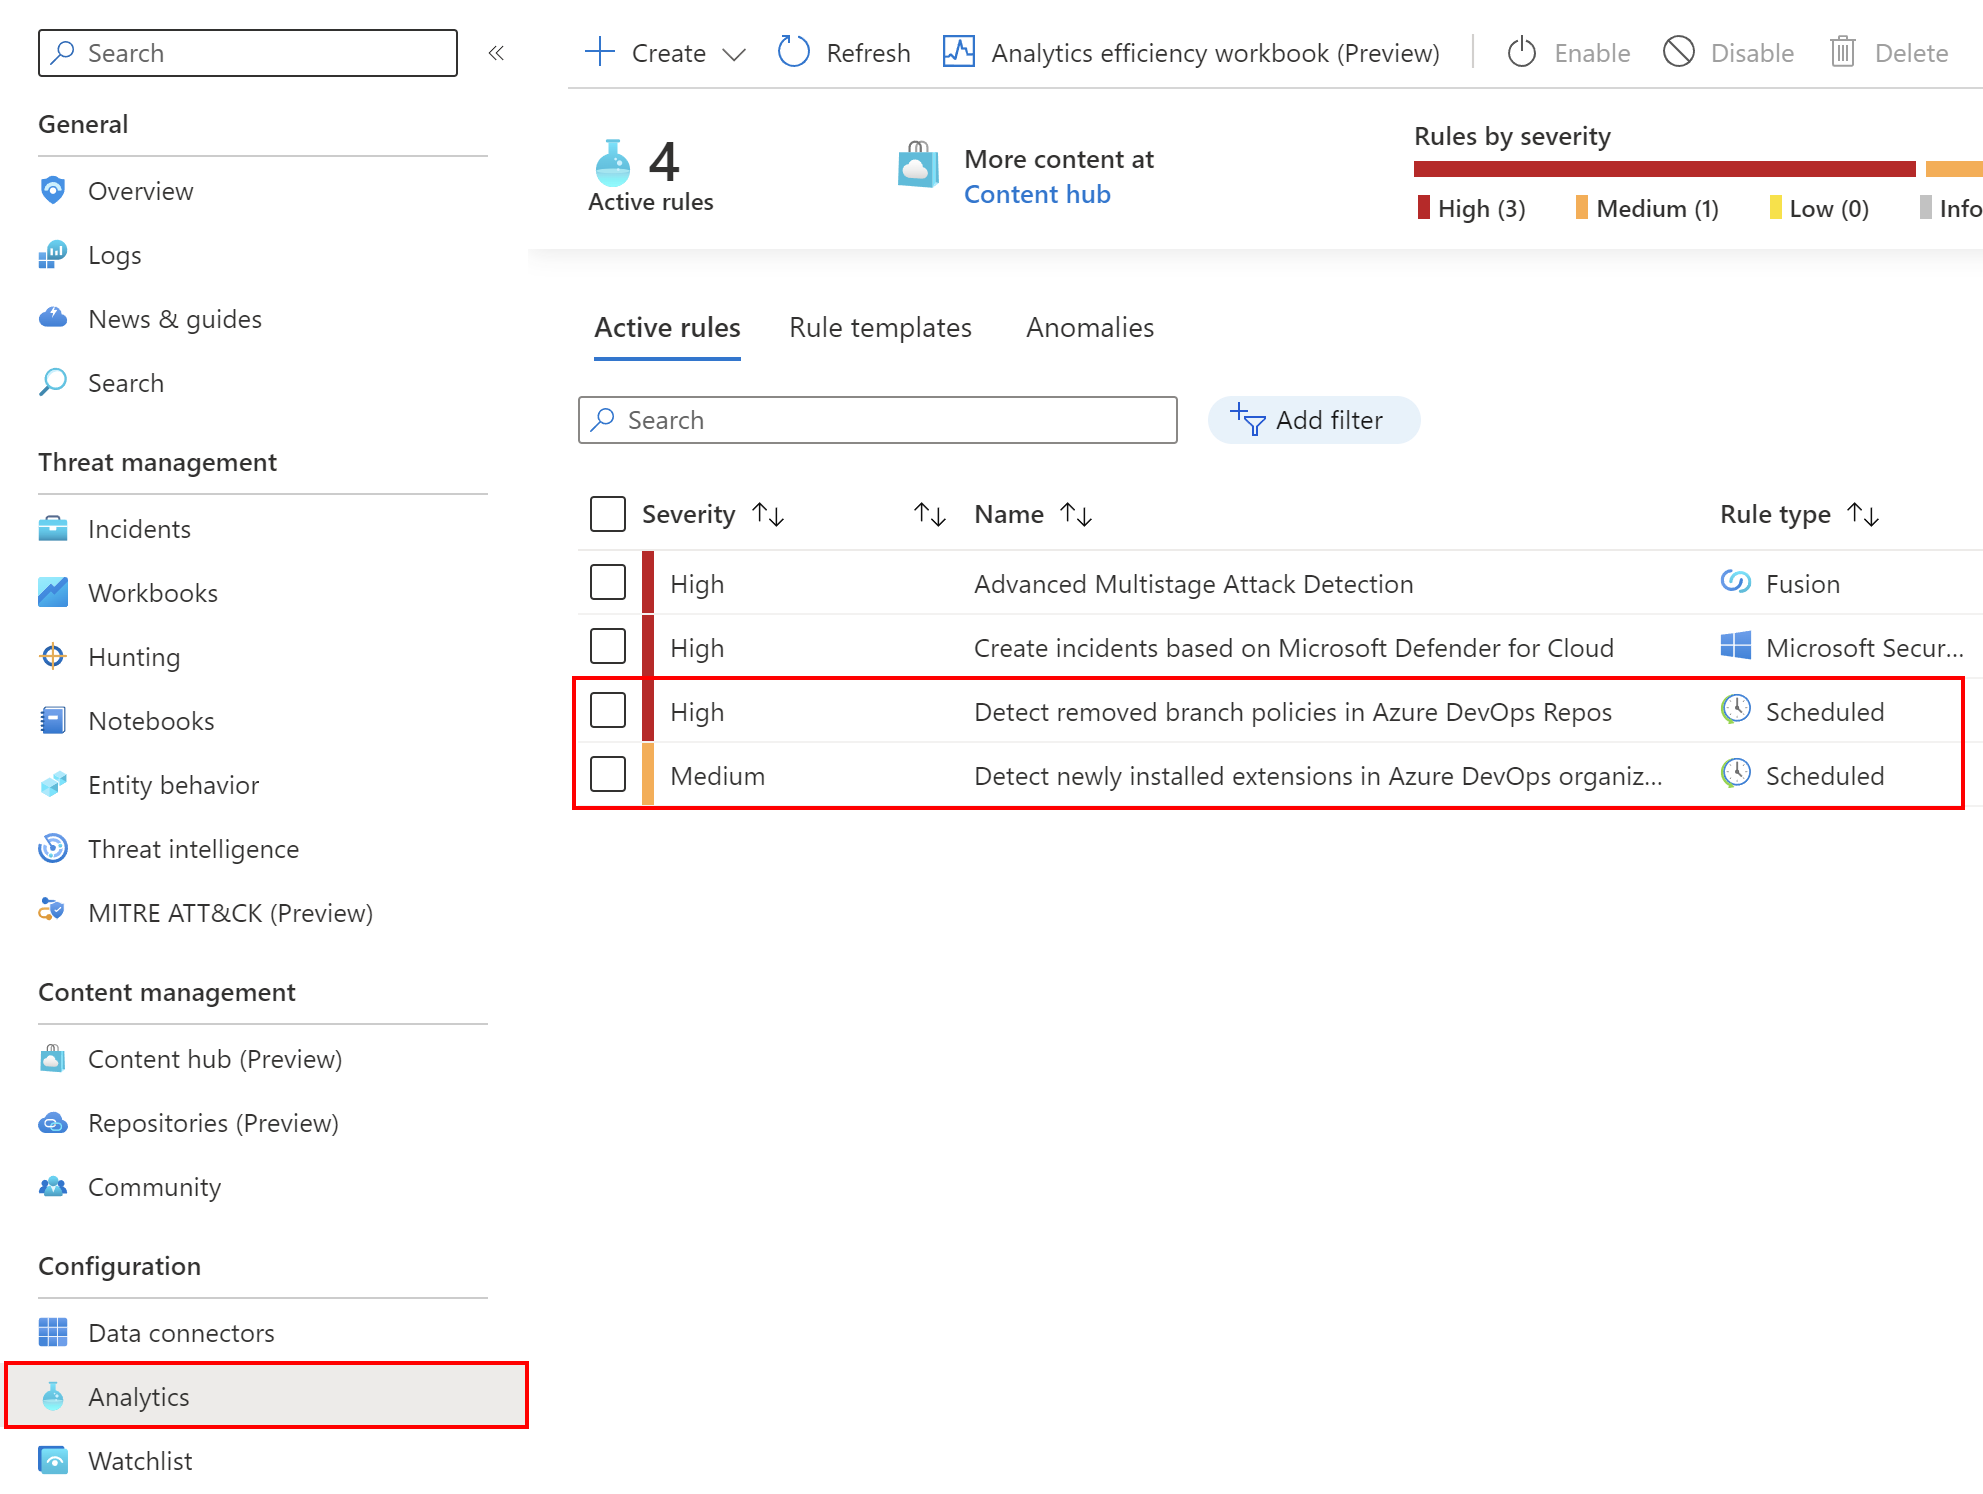
For the Detect removed branch policies in Azure DevOps Repos Analytics Rule I set the below logic:
AzureDevOpsAuditing
|
where Category contains "Remove"
and
OperationName contains "Policy.PolicyConfigRemoved"
|
extend RepositoryName = tostring(parse_json(tostring(Data)).RepoName)
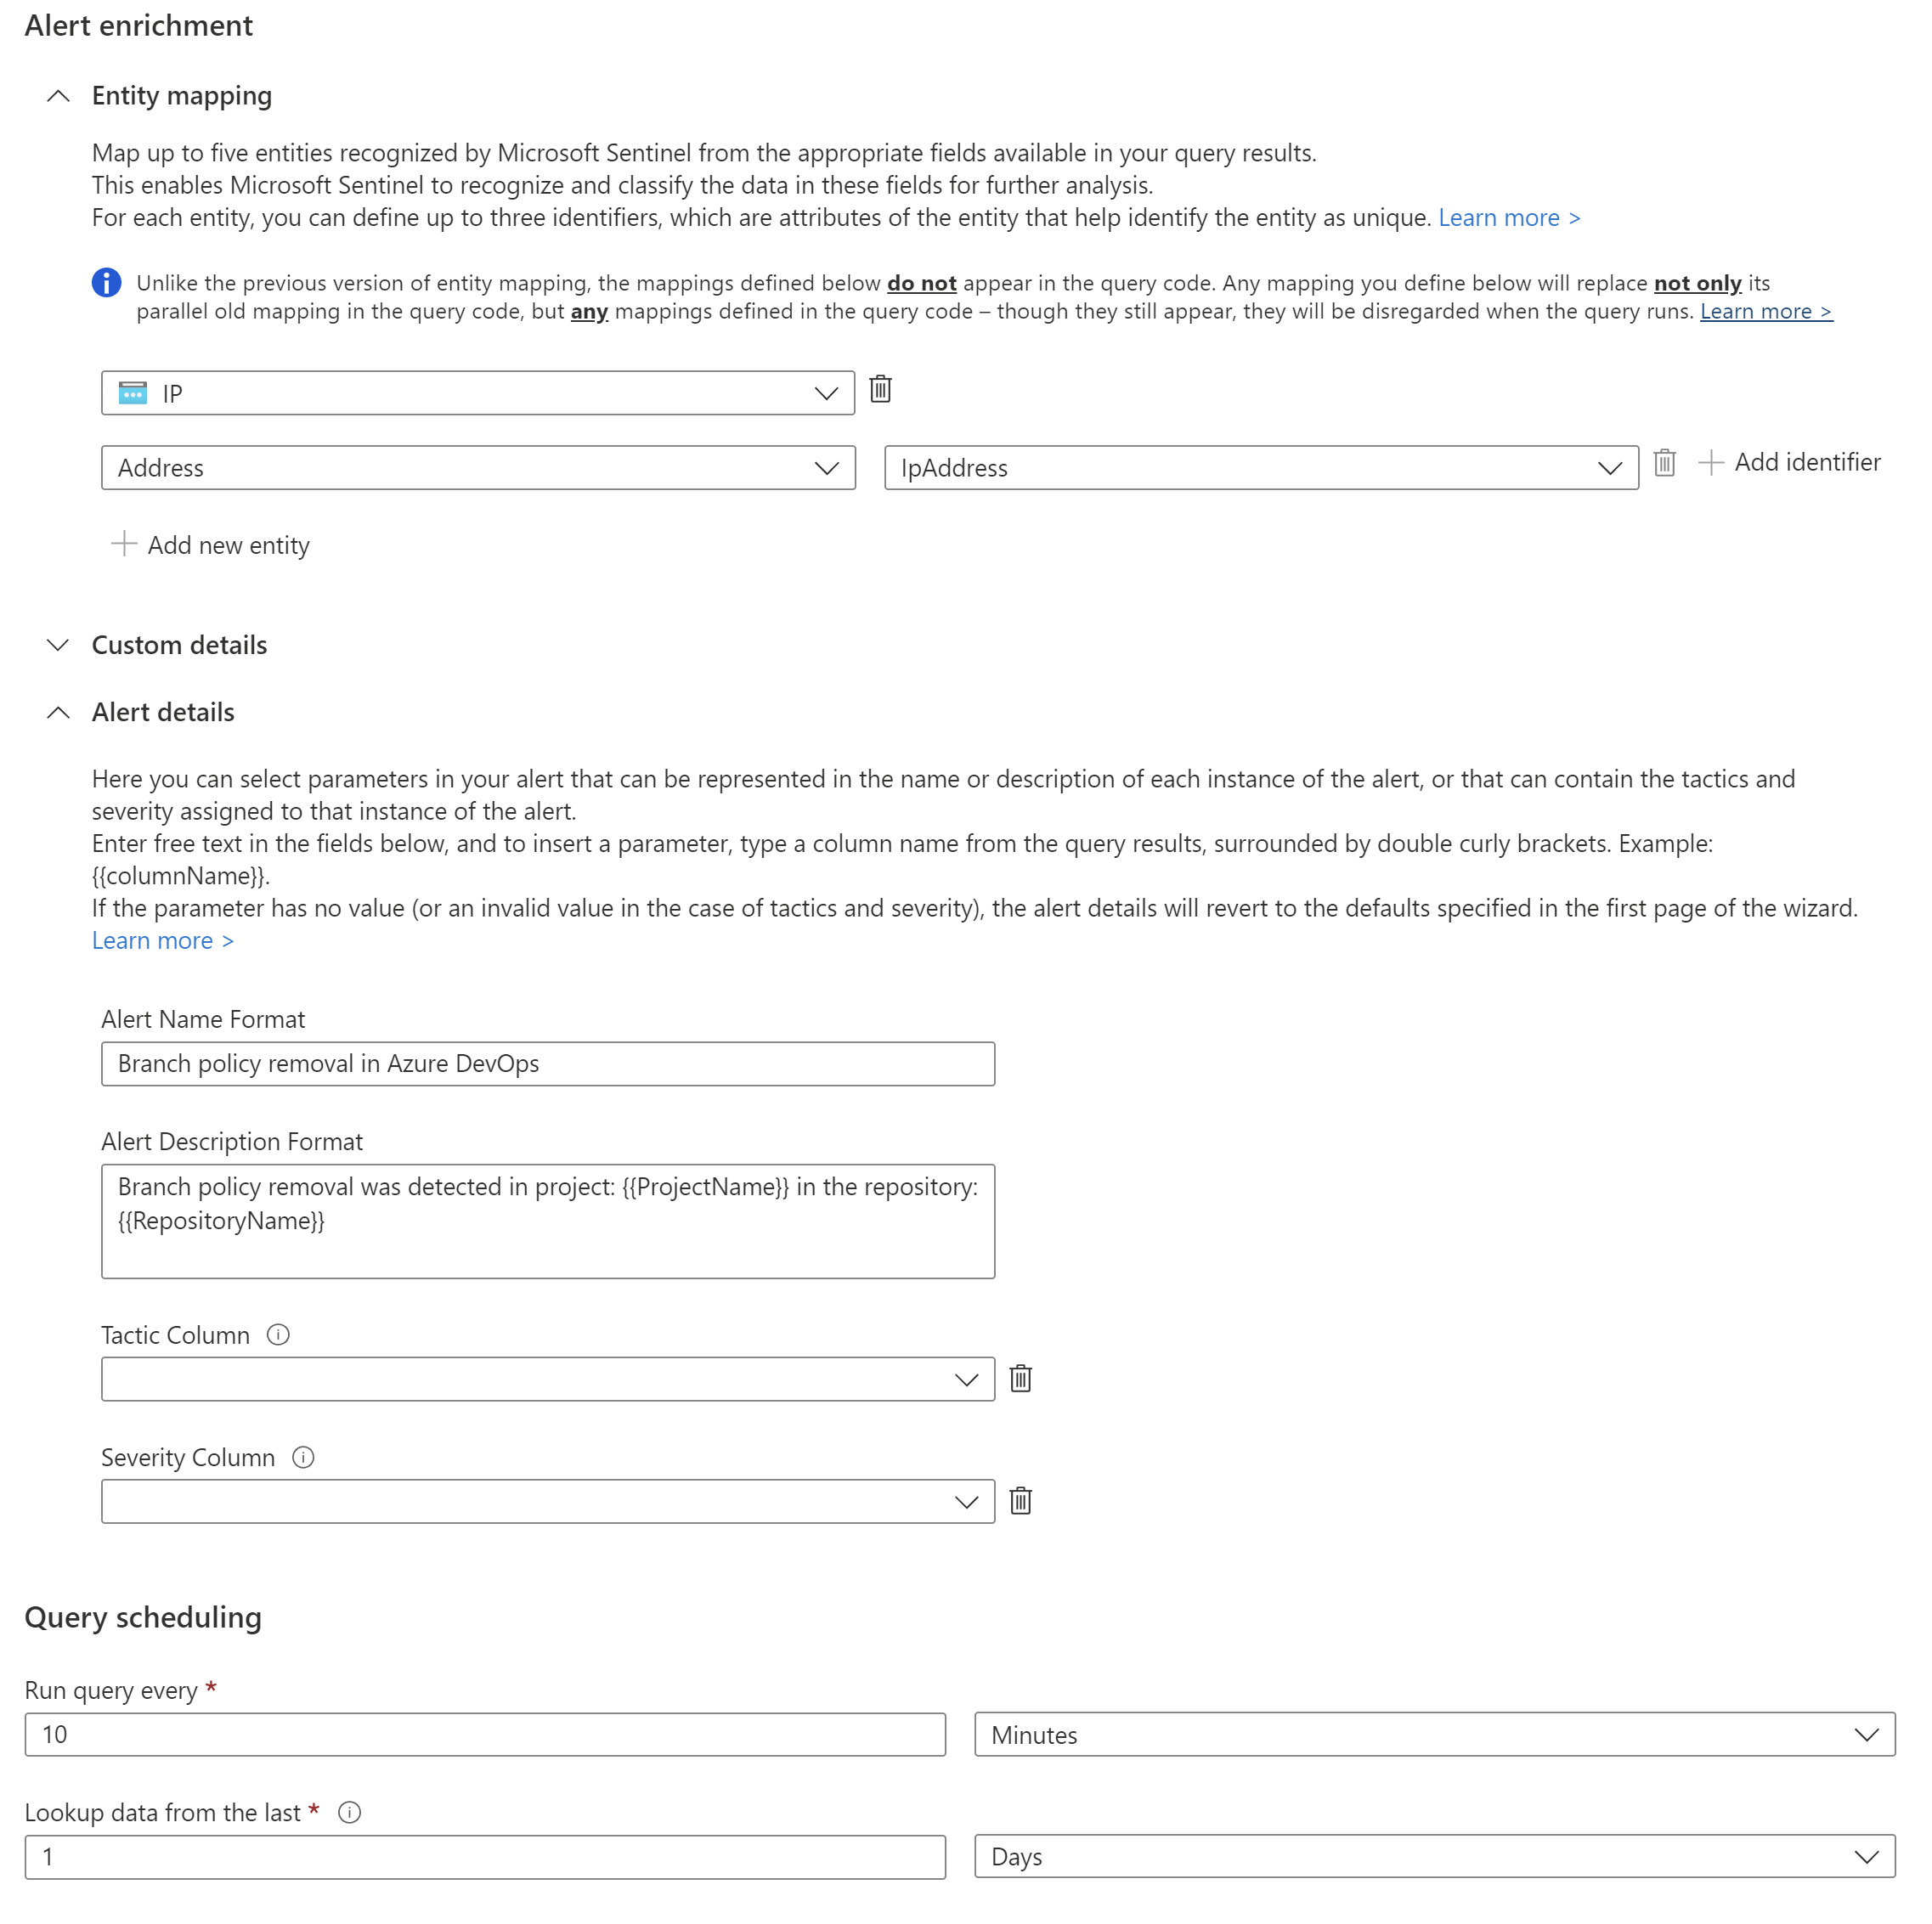
I also selected Group all events into a single alert to make sure that based on the above events, one alert will be generated in Microsoft Sentinel.
As the last step I configured creating incidents based on the alerts, and grouping the related alerts, triggered by this analytics rule, into incidents:

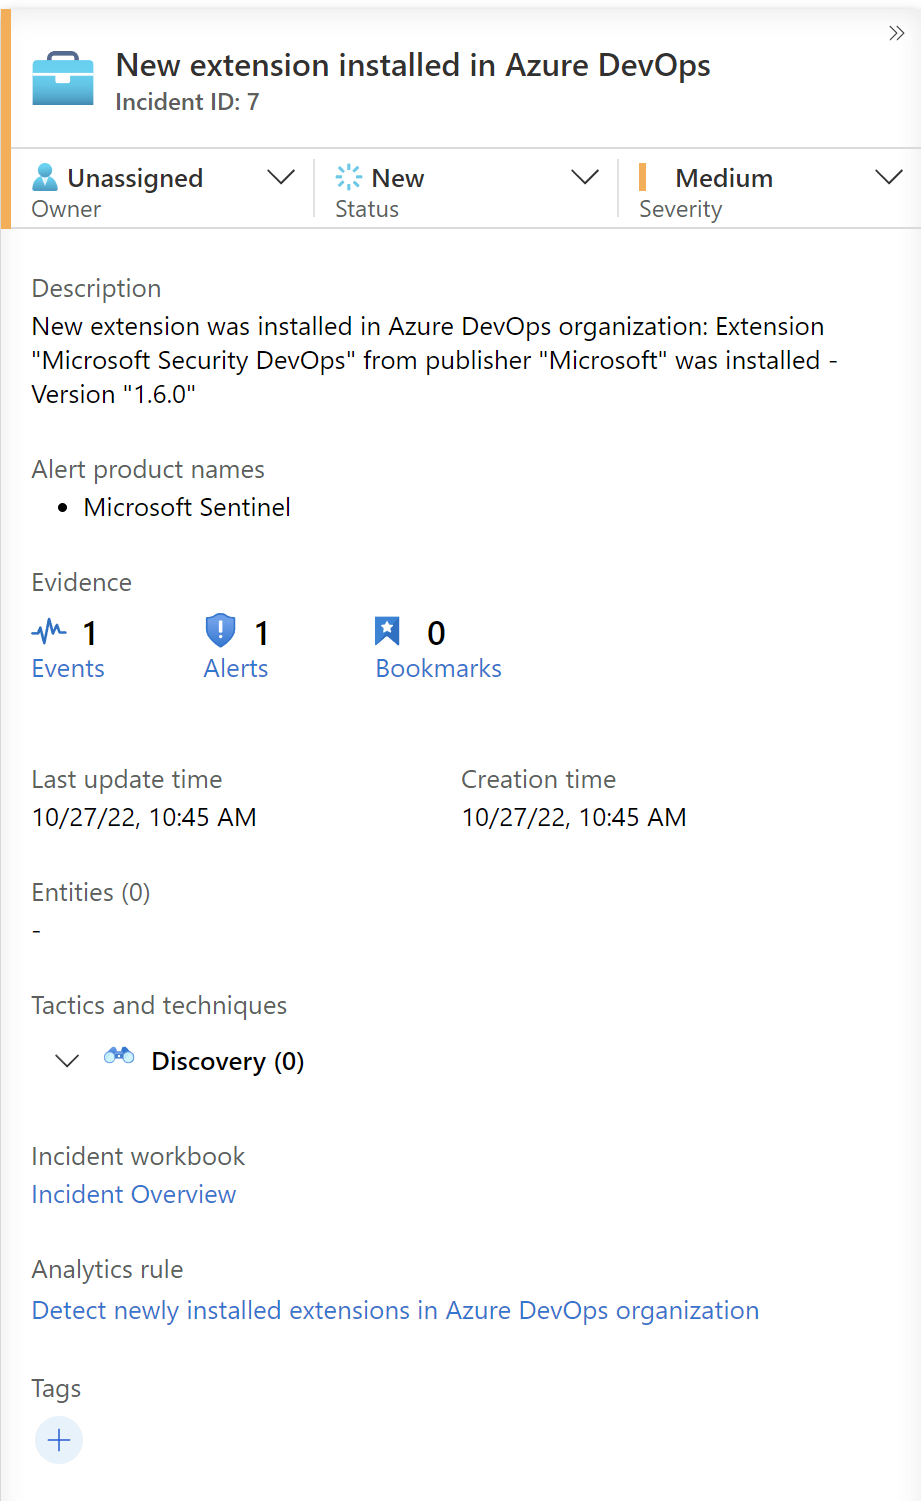
After a short time, incidents were created based on the events in Azure DevOps:

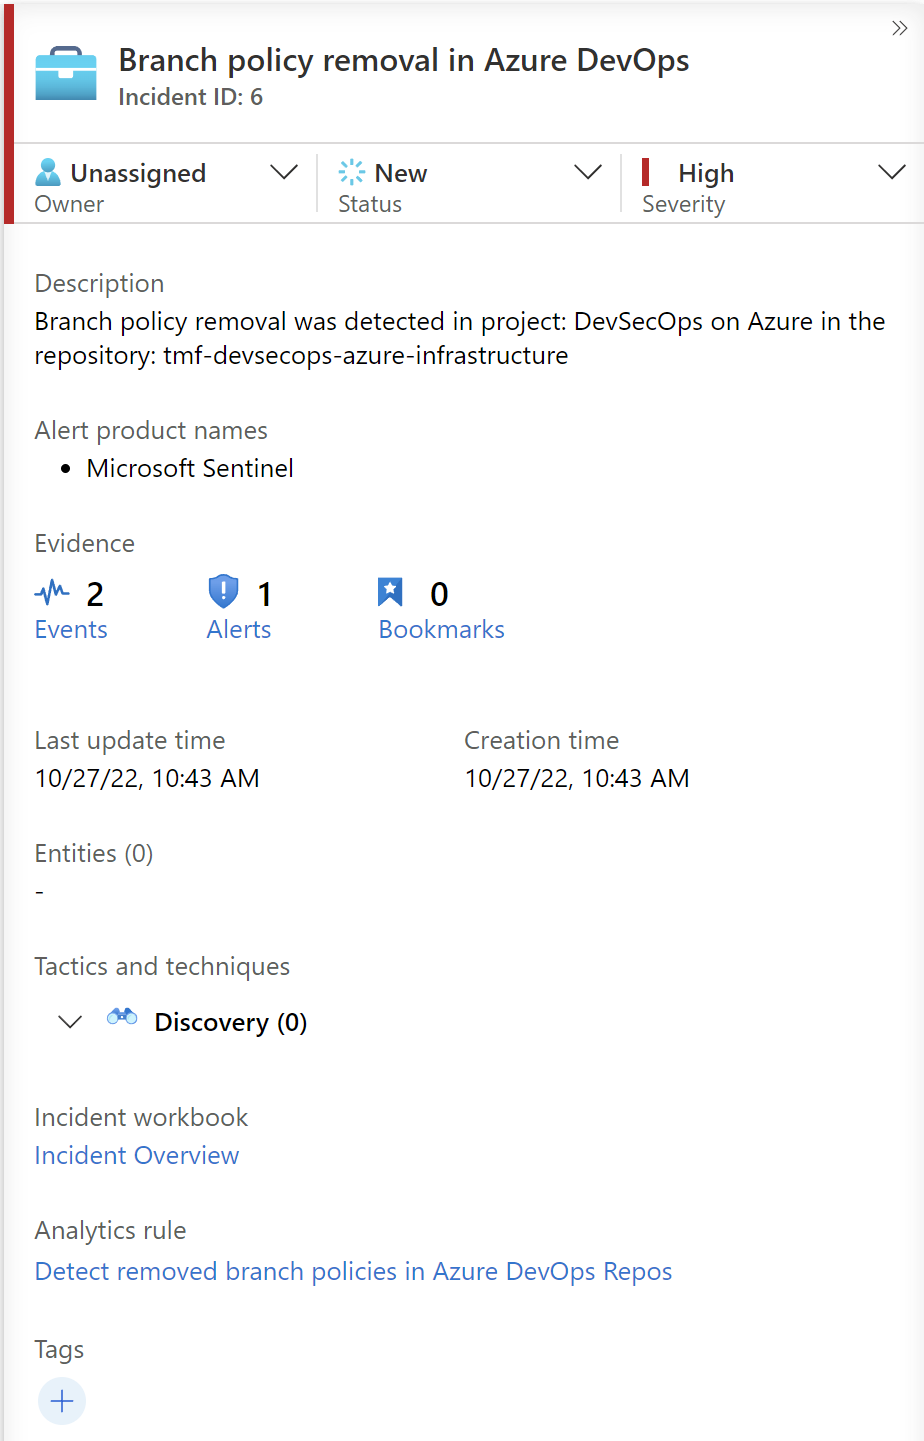
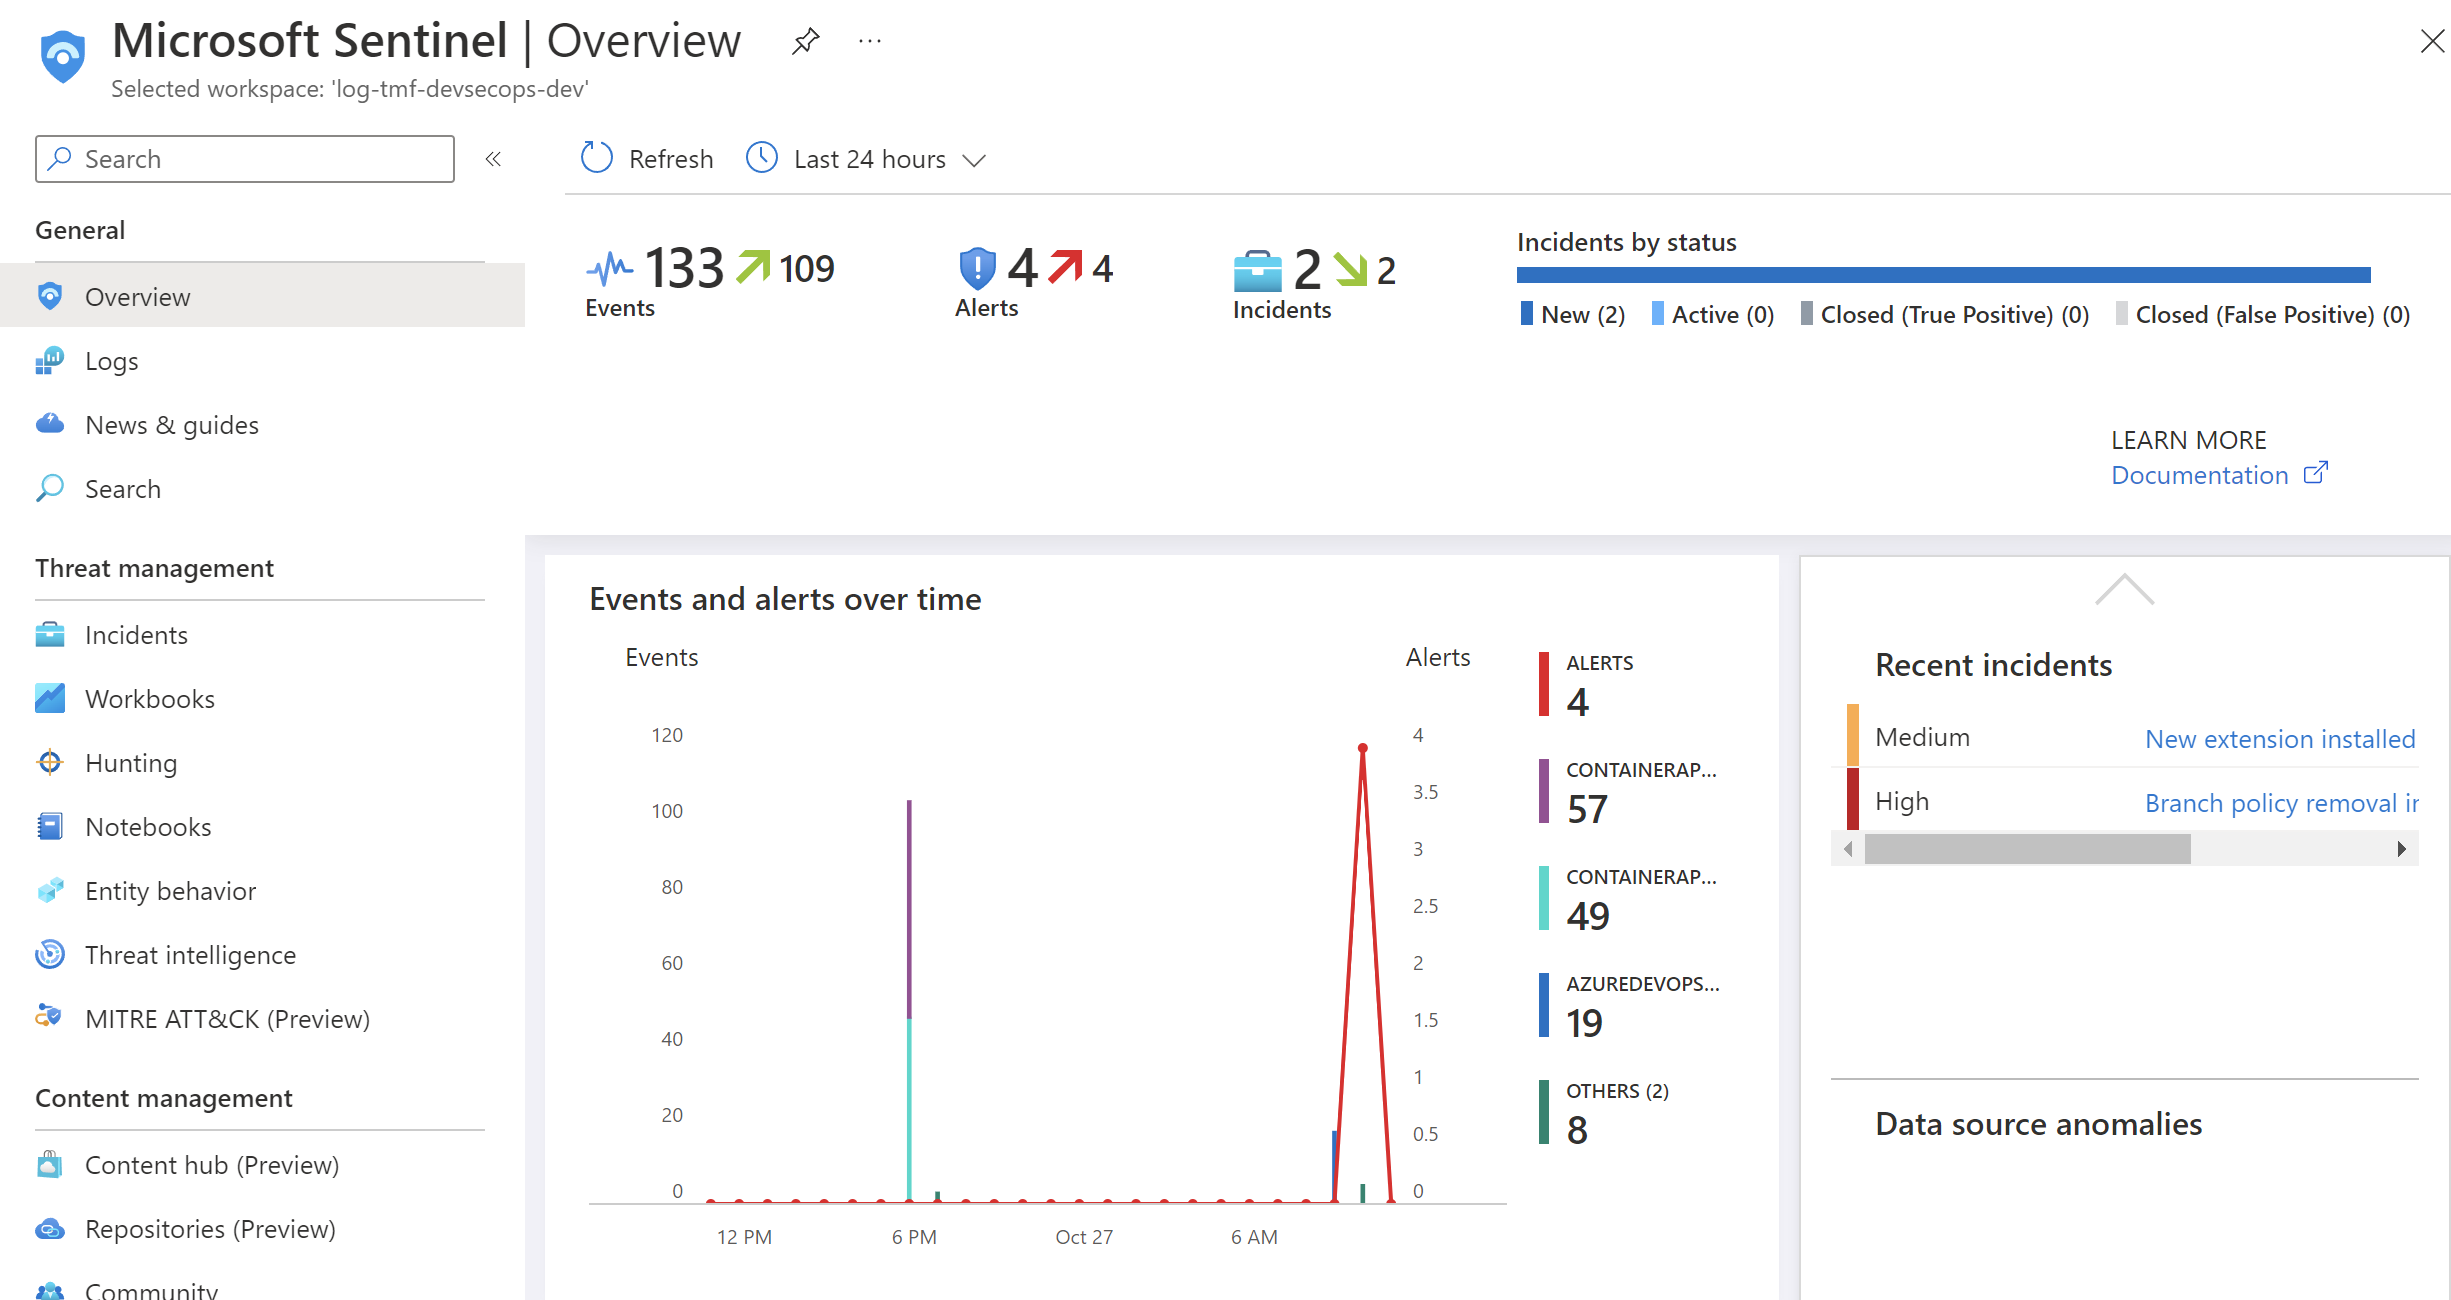
On the main dashboard we can see all, aggregated events and alerts, together with incidents:
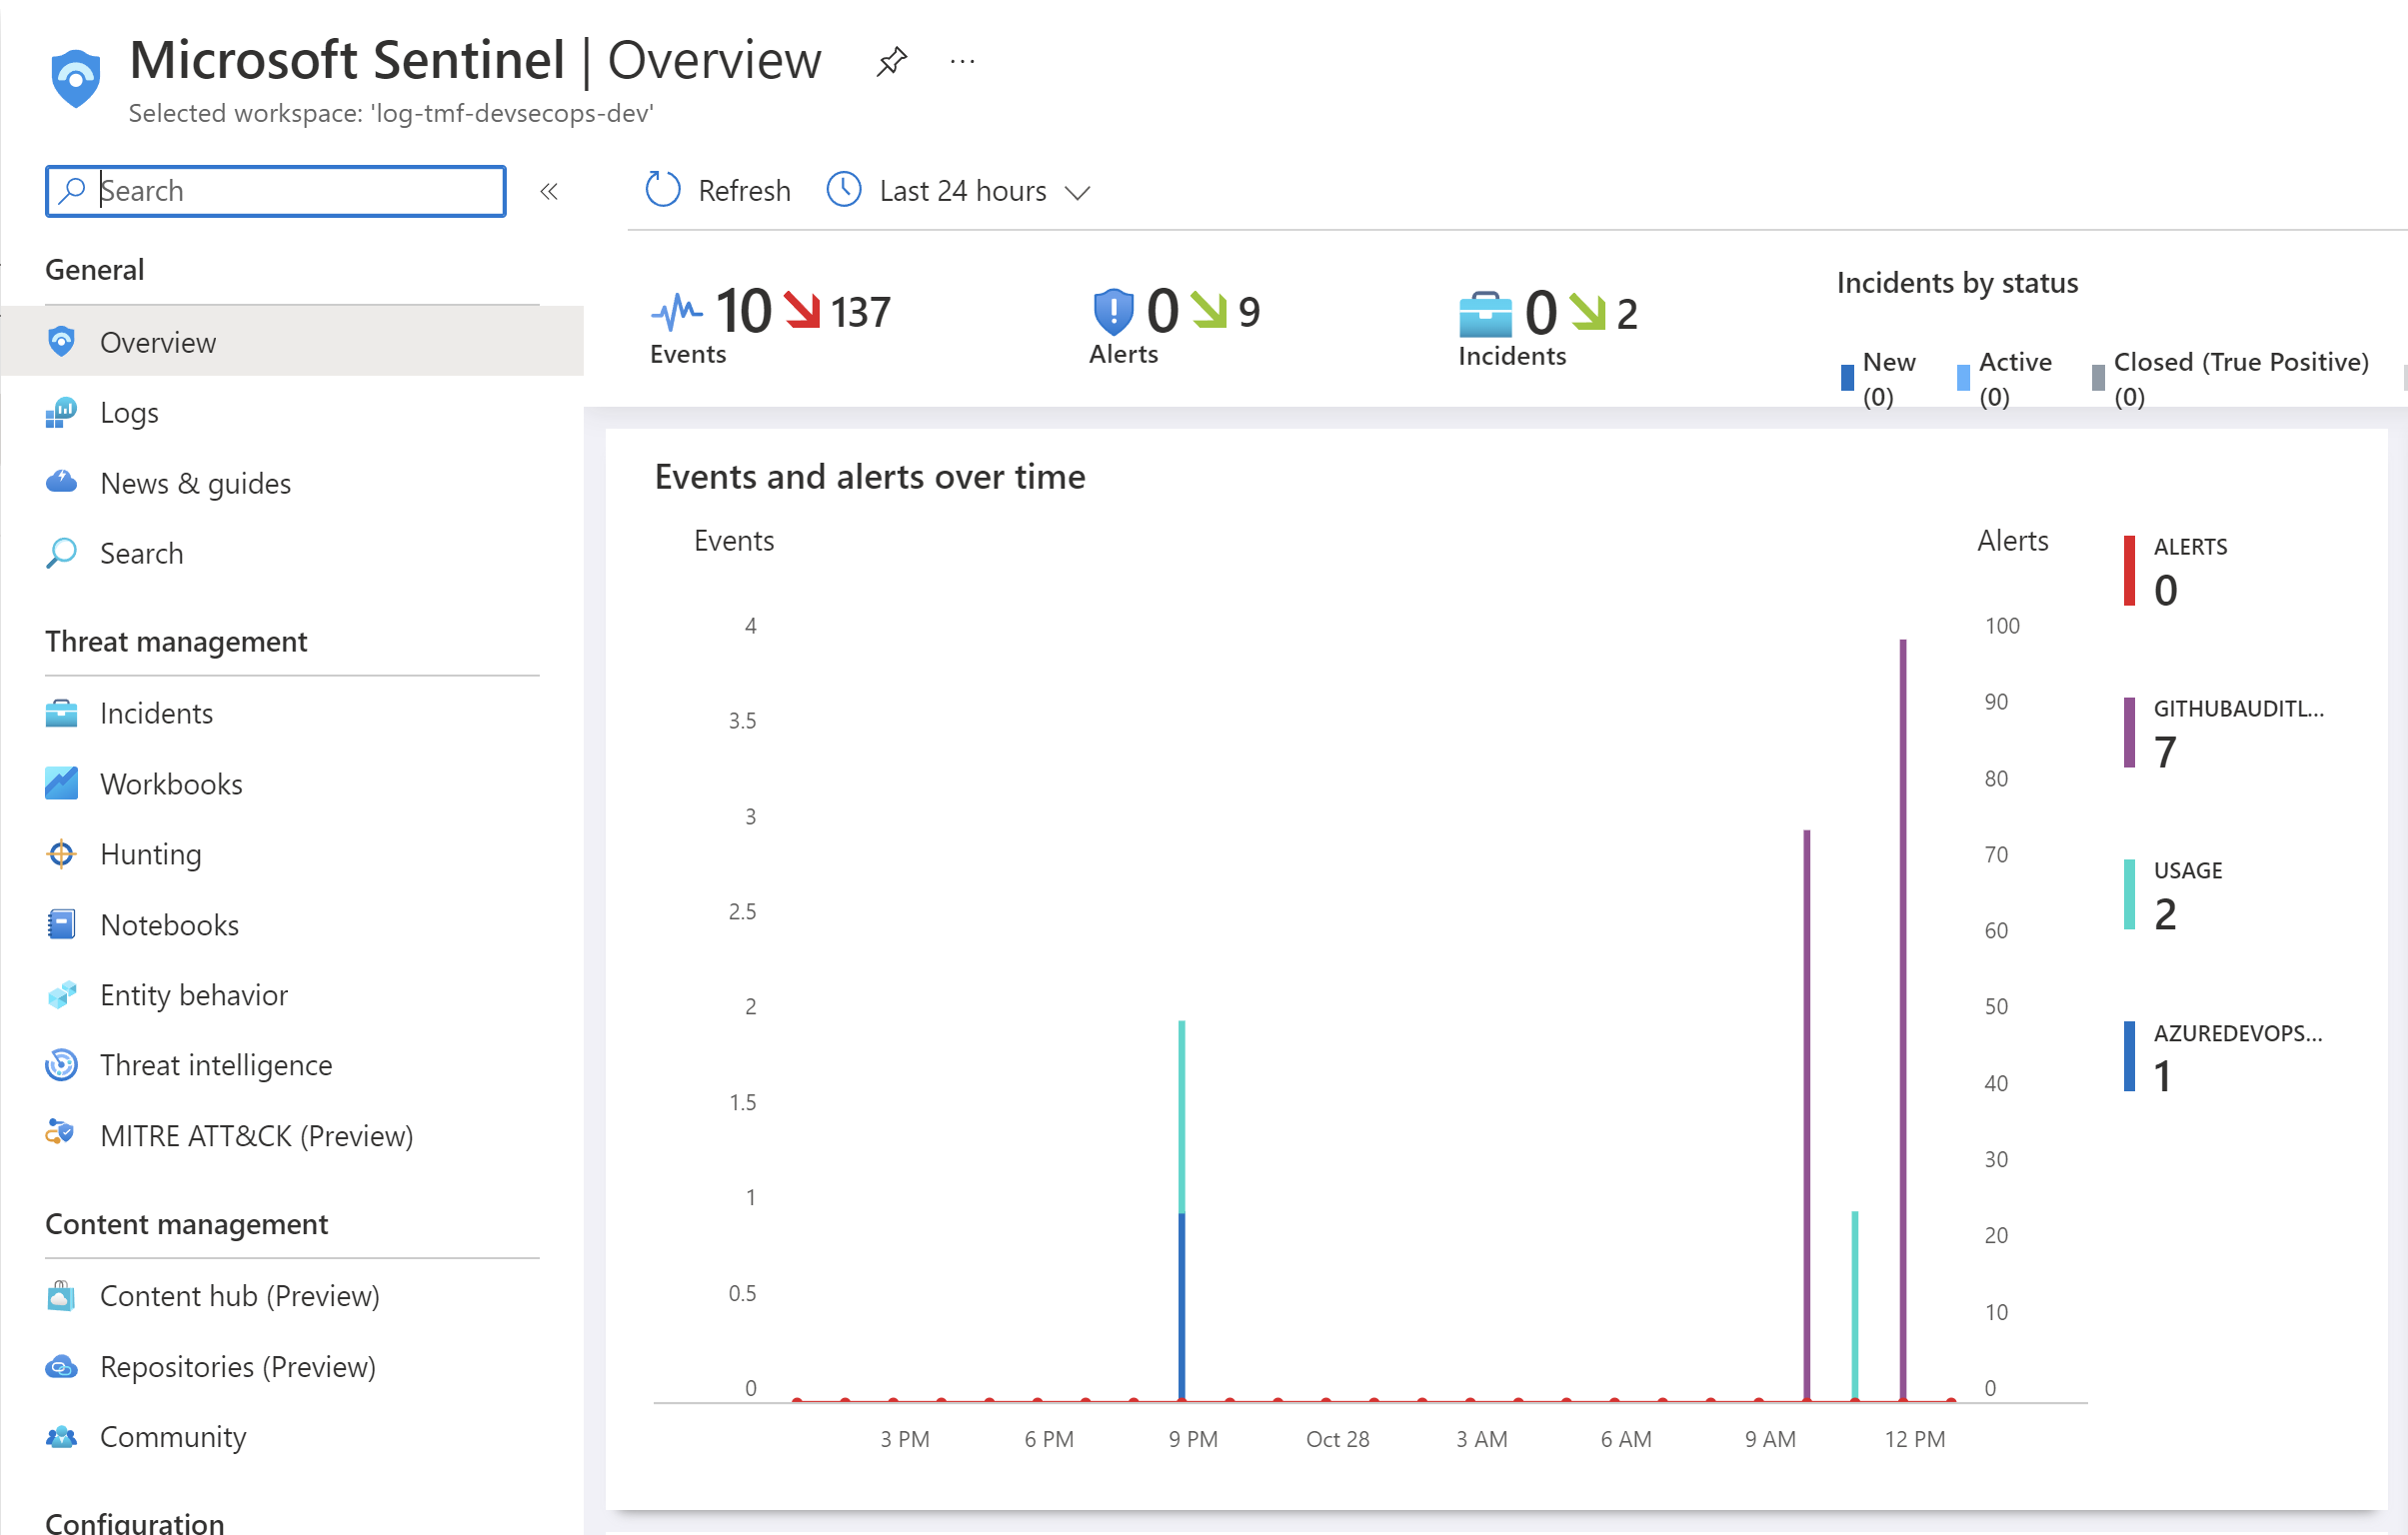
If we connect GitHub also, we have a comprehensive look into our DevOps platform’s security:
Summary
In this article, we discovered Microsoft Sentinel capabilities and how we can react to security incidents in our Azure cloud environment. We also learned how to monitor DevOps platforms like GitHub and Azure DevOps. I hope you had a chance to read previous articles from my series called DevSecOps practices for Azure cloud workloads, and you enjoyed it.
If you like my articles, and find them helpful, please buy me a coffee:


